Working with Statistics Canada Data in R, Part 6: Visualizing Census Data
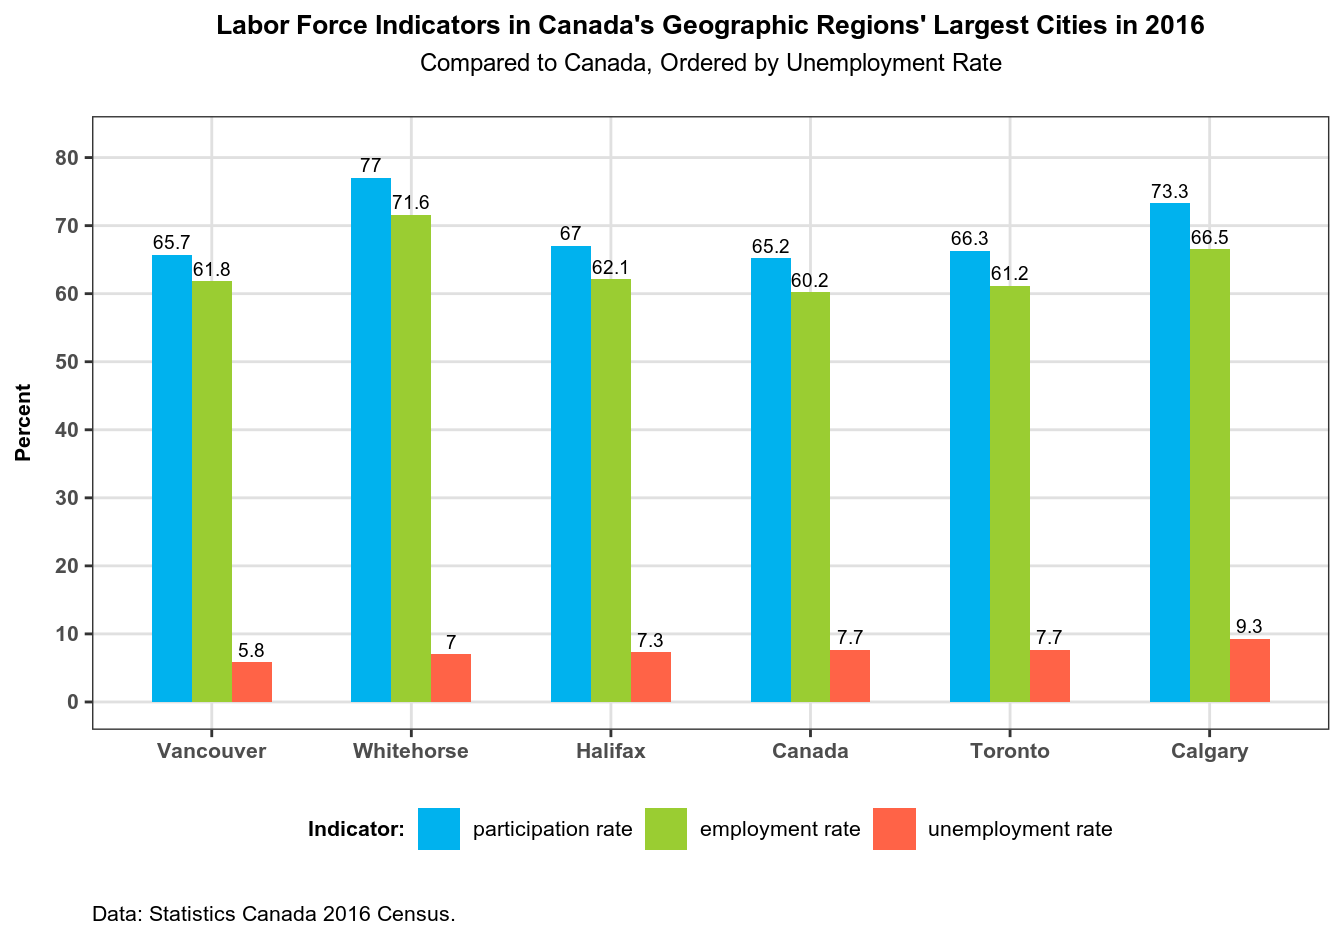
Back to Working with Statistics Canada Data in R, Part 5. Introduction Ordered Bar Plot: Labor Force Involvement Rates Creating an Ordering Vector Making an Ordered Bar Plot Saving the Plot Faceted Plot: Full Time vs Part Time Workers, by Gender Preparing the Data for Plotting Making a Faceted Donut Plot ...