Articles by exploRations in R

Multiple Gauge Plots with Facet Wrap

October 17, 2020 | exploRations in R

Intro Here are some good examples of how to generate gauge plots including multiple gauge plots in R found at stackoverflow. My use case, however, requires the ability to vary the number of plots based on the number of metrics fed into the funct...
[Read more...]

Introducing Boundingbox Package

June 11, 2020 | exploRations in R

library(boundingbox)
Intro When we create bounding boxes in images, particularly if we intend to feed them into predictive models for object localization and classification, we are often: Processing many images Classifying the contents of the bounding boxes Standardizing the size of the images Capturing the coordinates The boundingbox package v1.0.1 ...
[Read more...]

Replicating Plots: Oil Pathways

February 7, 2020 | exploRations in R

Intro I was inspired by this graphic on Yahoo Finance. In the TidyTuesday spirit, I set out to recreate it using ggplot2. There were a few things I would have to figure out - how to apply ggtext to an annotation, how to draw a curved arrow, and how to ...
[Read more...]

Autumn Barnsley Fern

October 12, 2019 | exploRations in R

Intro I was playing around generating fractals in R when I realized the monochromatic green Barnsely Fern I had on my screen didn’t quite look like the leaves I could see outside my window. It was already Fall. In this post I describe a technique to generate a Barnsley ...
[Read more...]

recursive shape fractal generator

August 19, 2019 | exploRations in R

Intro 
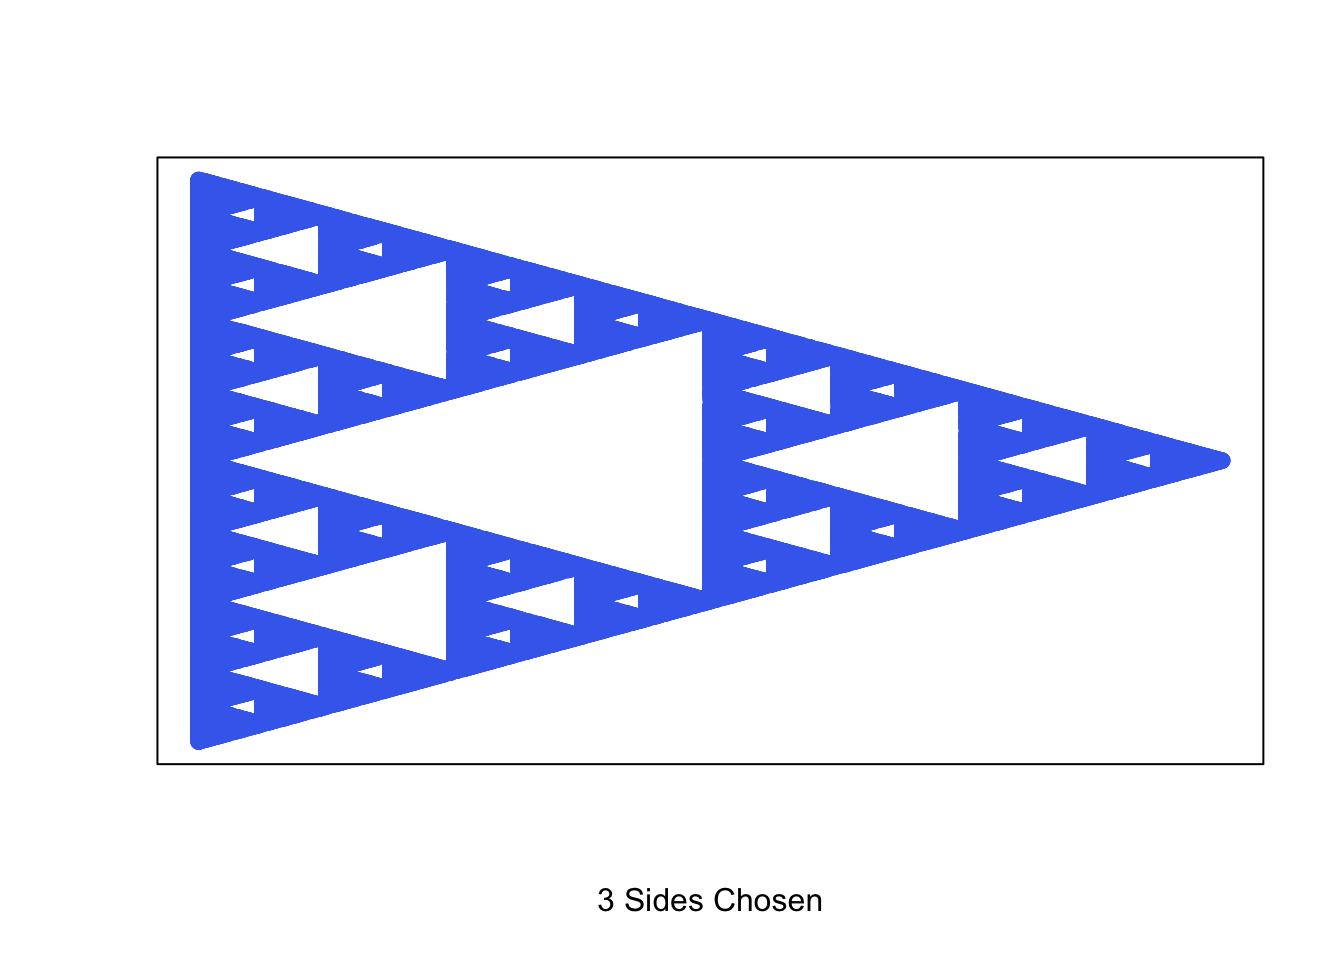
This function allows us to generate the Sierpinski Triangle and explore other recursive shapes with equal length sides following the same algorithm.
shape <- function(corners, trials = 100000){
    
    corners <- as.integer(corners)
    points <- list()

    if (corners < 3) stop("Value should be 3 or greater")
 
    for (n in 1:(corners)){
     points$x[n] <- 0 + cos((2*pi*n)/corners)
        points$y[n] <- 0 + sin((2*pi*n)/corners)
    }

    x <- points$x[1]
    y <- points$y[1]

    trials <- trials
    sierpinski <- list()

    for (t in 1:trials){
        r <- sample(1:corners,1)
        x <- (x + points$x[r]) / sqrt(corners + 1)
        y <- (y + points$y[r]) / sqrt(corners + 1)
        sierpinski$x[t] <- x
        sierpinski$y[t] <- y
    }

 
    # I use these colors for random color selection. Update for your own desired selection.
    color <- sample(c("royalblue2", "firebrick2", "gold2", "springgreen3", "purple2", "darkorange1"),1)

    plot(sierpinski$x[corners:trials], sierpinski$y[corners:trials],
        xlab = paste0(corners, " Sides Chosen"), ylab = "", xaxt = "n", yaxt = "n", col = color)

}
When you run the function, you indicate the number of sides for the polygon and adjust the number of trials to change the resolution if desired. ...
[Read more...]

Stacked Waterfall Graphs in R

June 21, 2019 | exploRations in R

Intro In an earlier post I provided a template for creating a basic waterfall graph. Here I introduce a slightly more complex version with stacked bars over a time series. I use dplyr, ggplot2 and lubridate libraries. Stacked Waterfall Graphs This is a version of a waterfall graph I have ...
[Read more...]

Basic Waterfall Graphs in R

May 26, 2019 | exploRations in R

Intro Waterfall graphs are an effective visualization of what could be many increments and decrements that account for the difference between two values. In management information systems, for example, these graphs are often used to represent how an organization uses its budget, or how each product line contributed to total ...
[Read more...]

Never miss an update!
Subscribe to R-bloggers to receive
e-mails with the latest R posts.
(You will not see this message again.)

Click here to close (This popup will not appear again)