Articles by R on OSM

One-N against the world!

November 1, 2021 | R on OSM

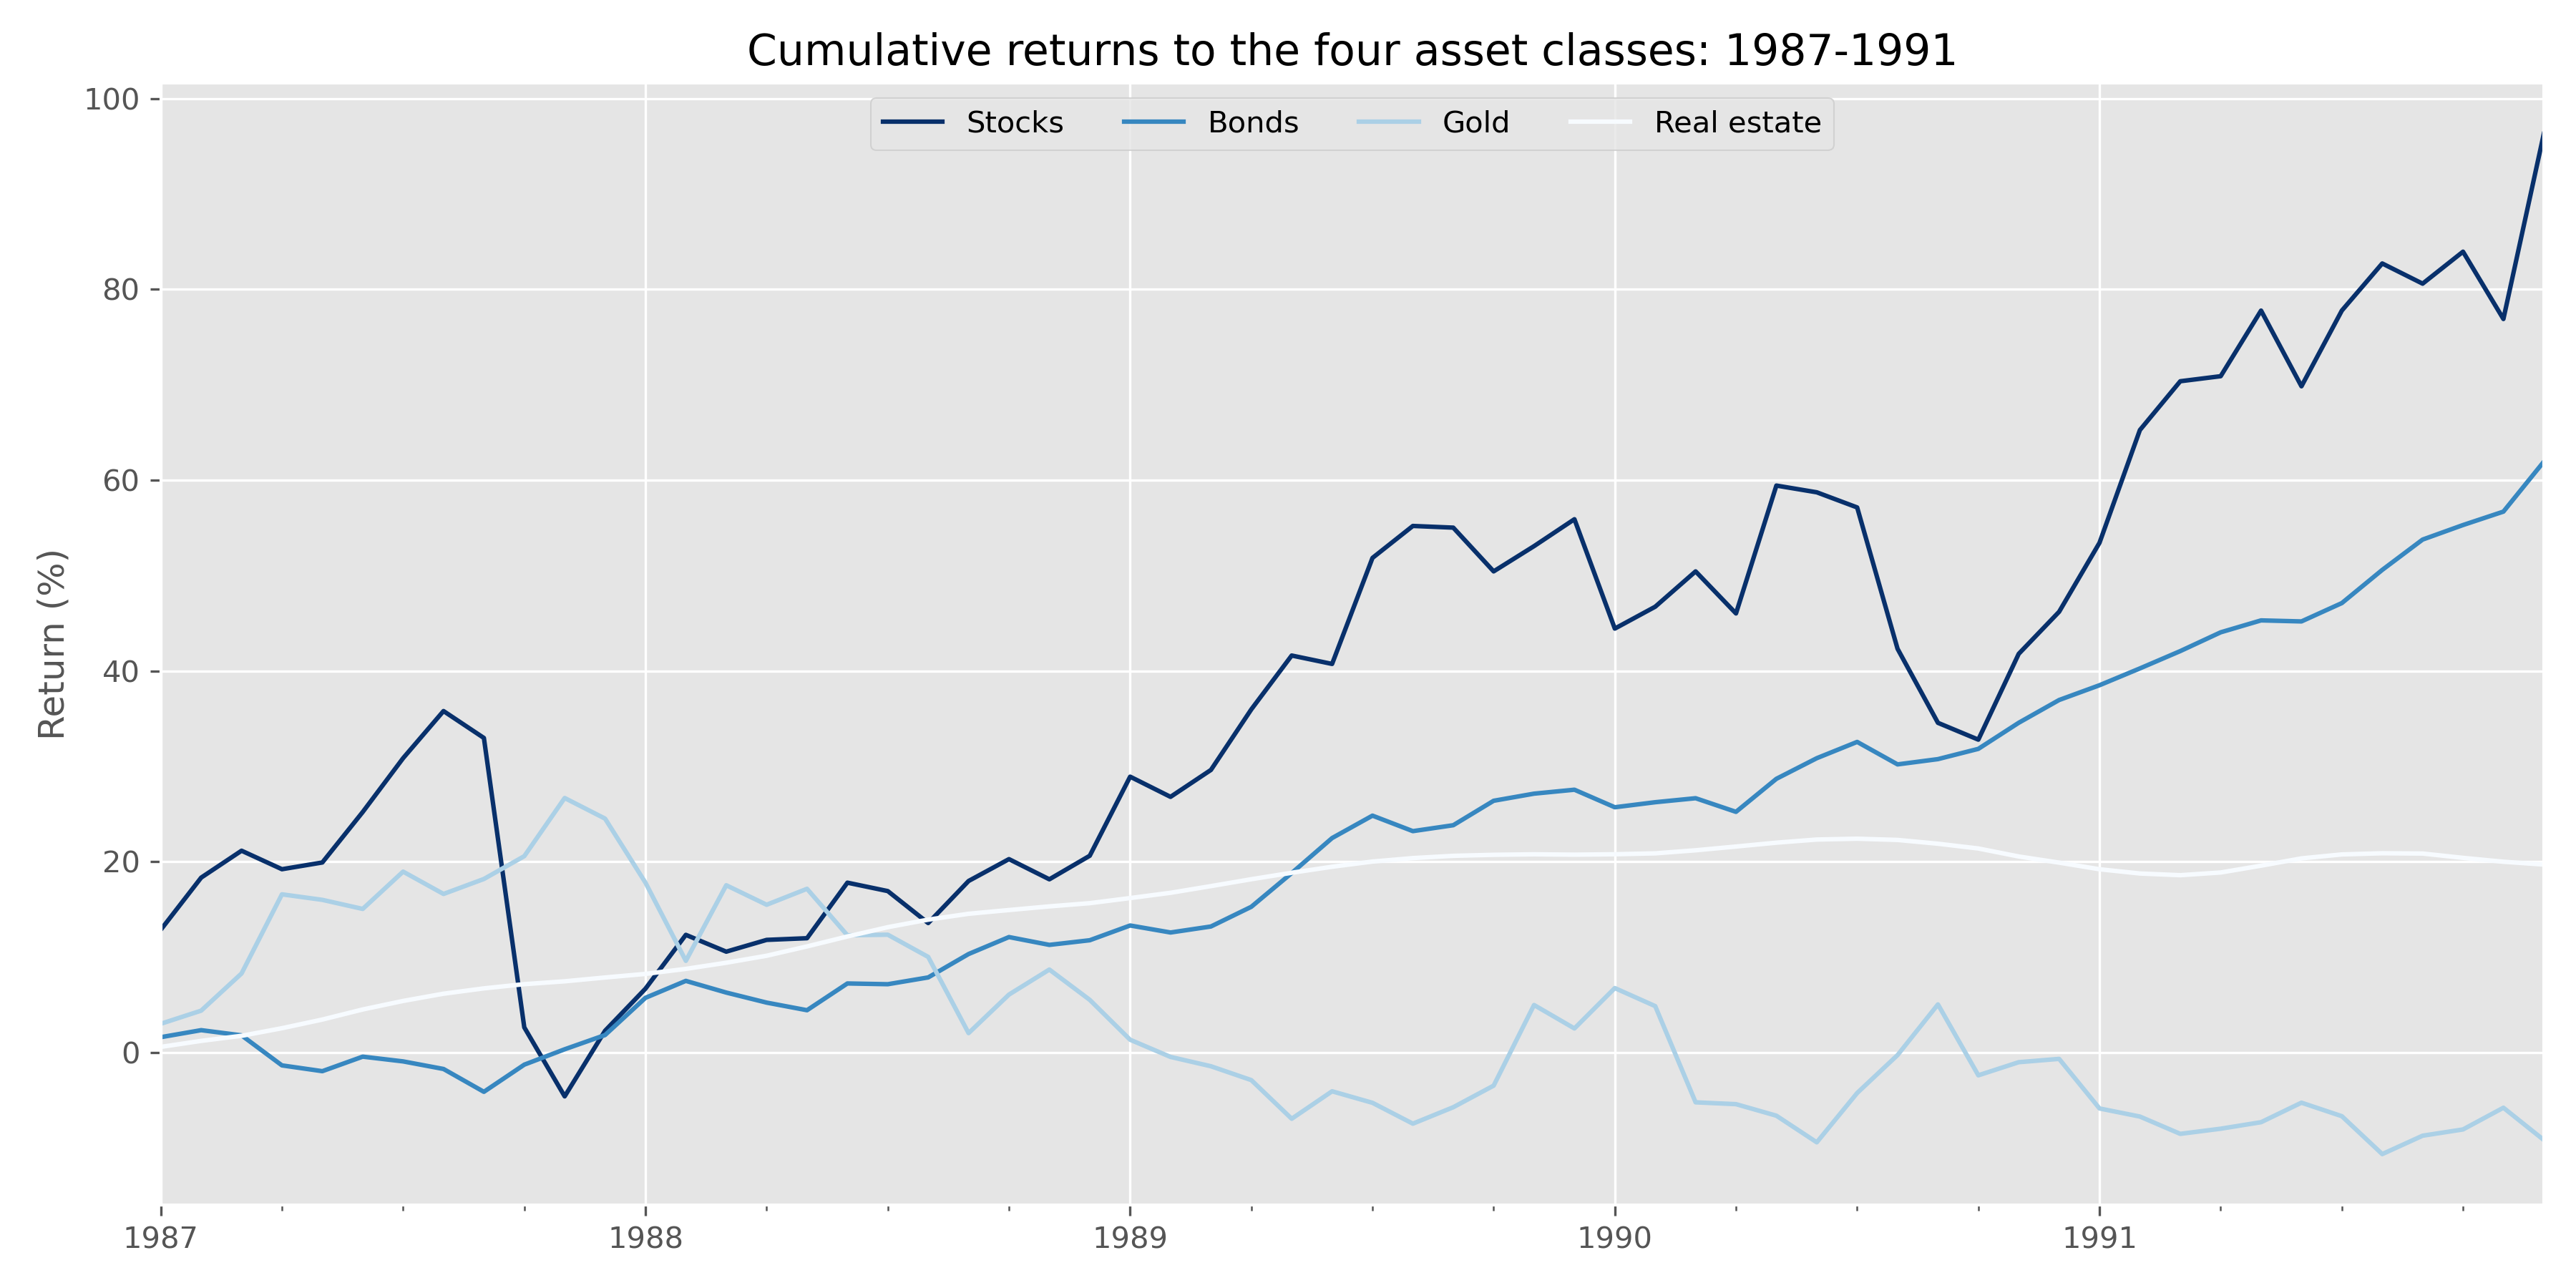
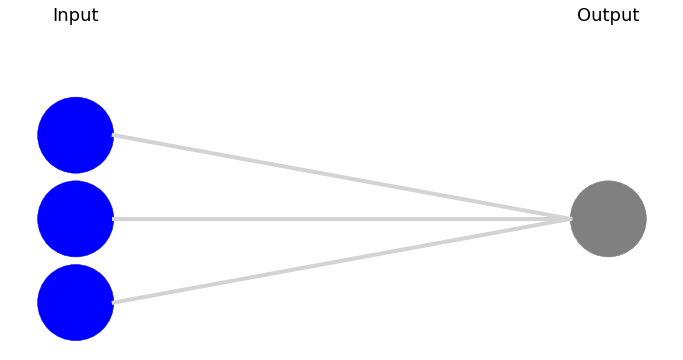
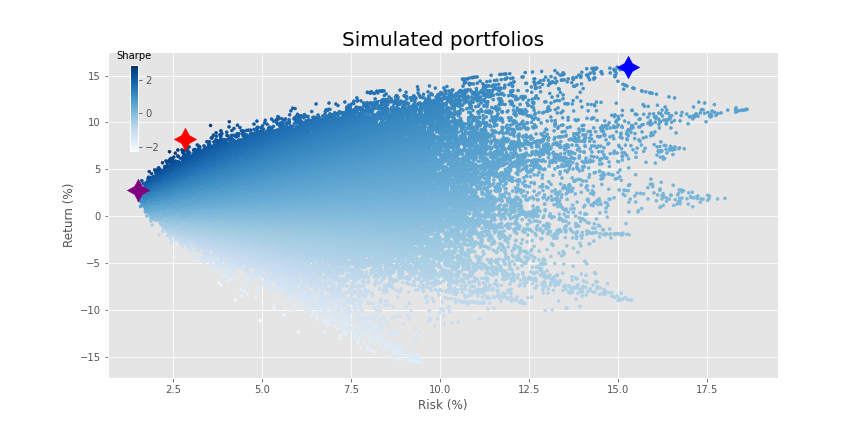
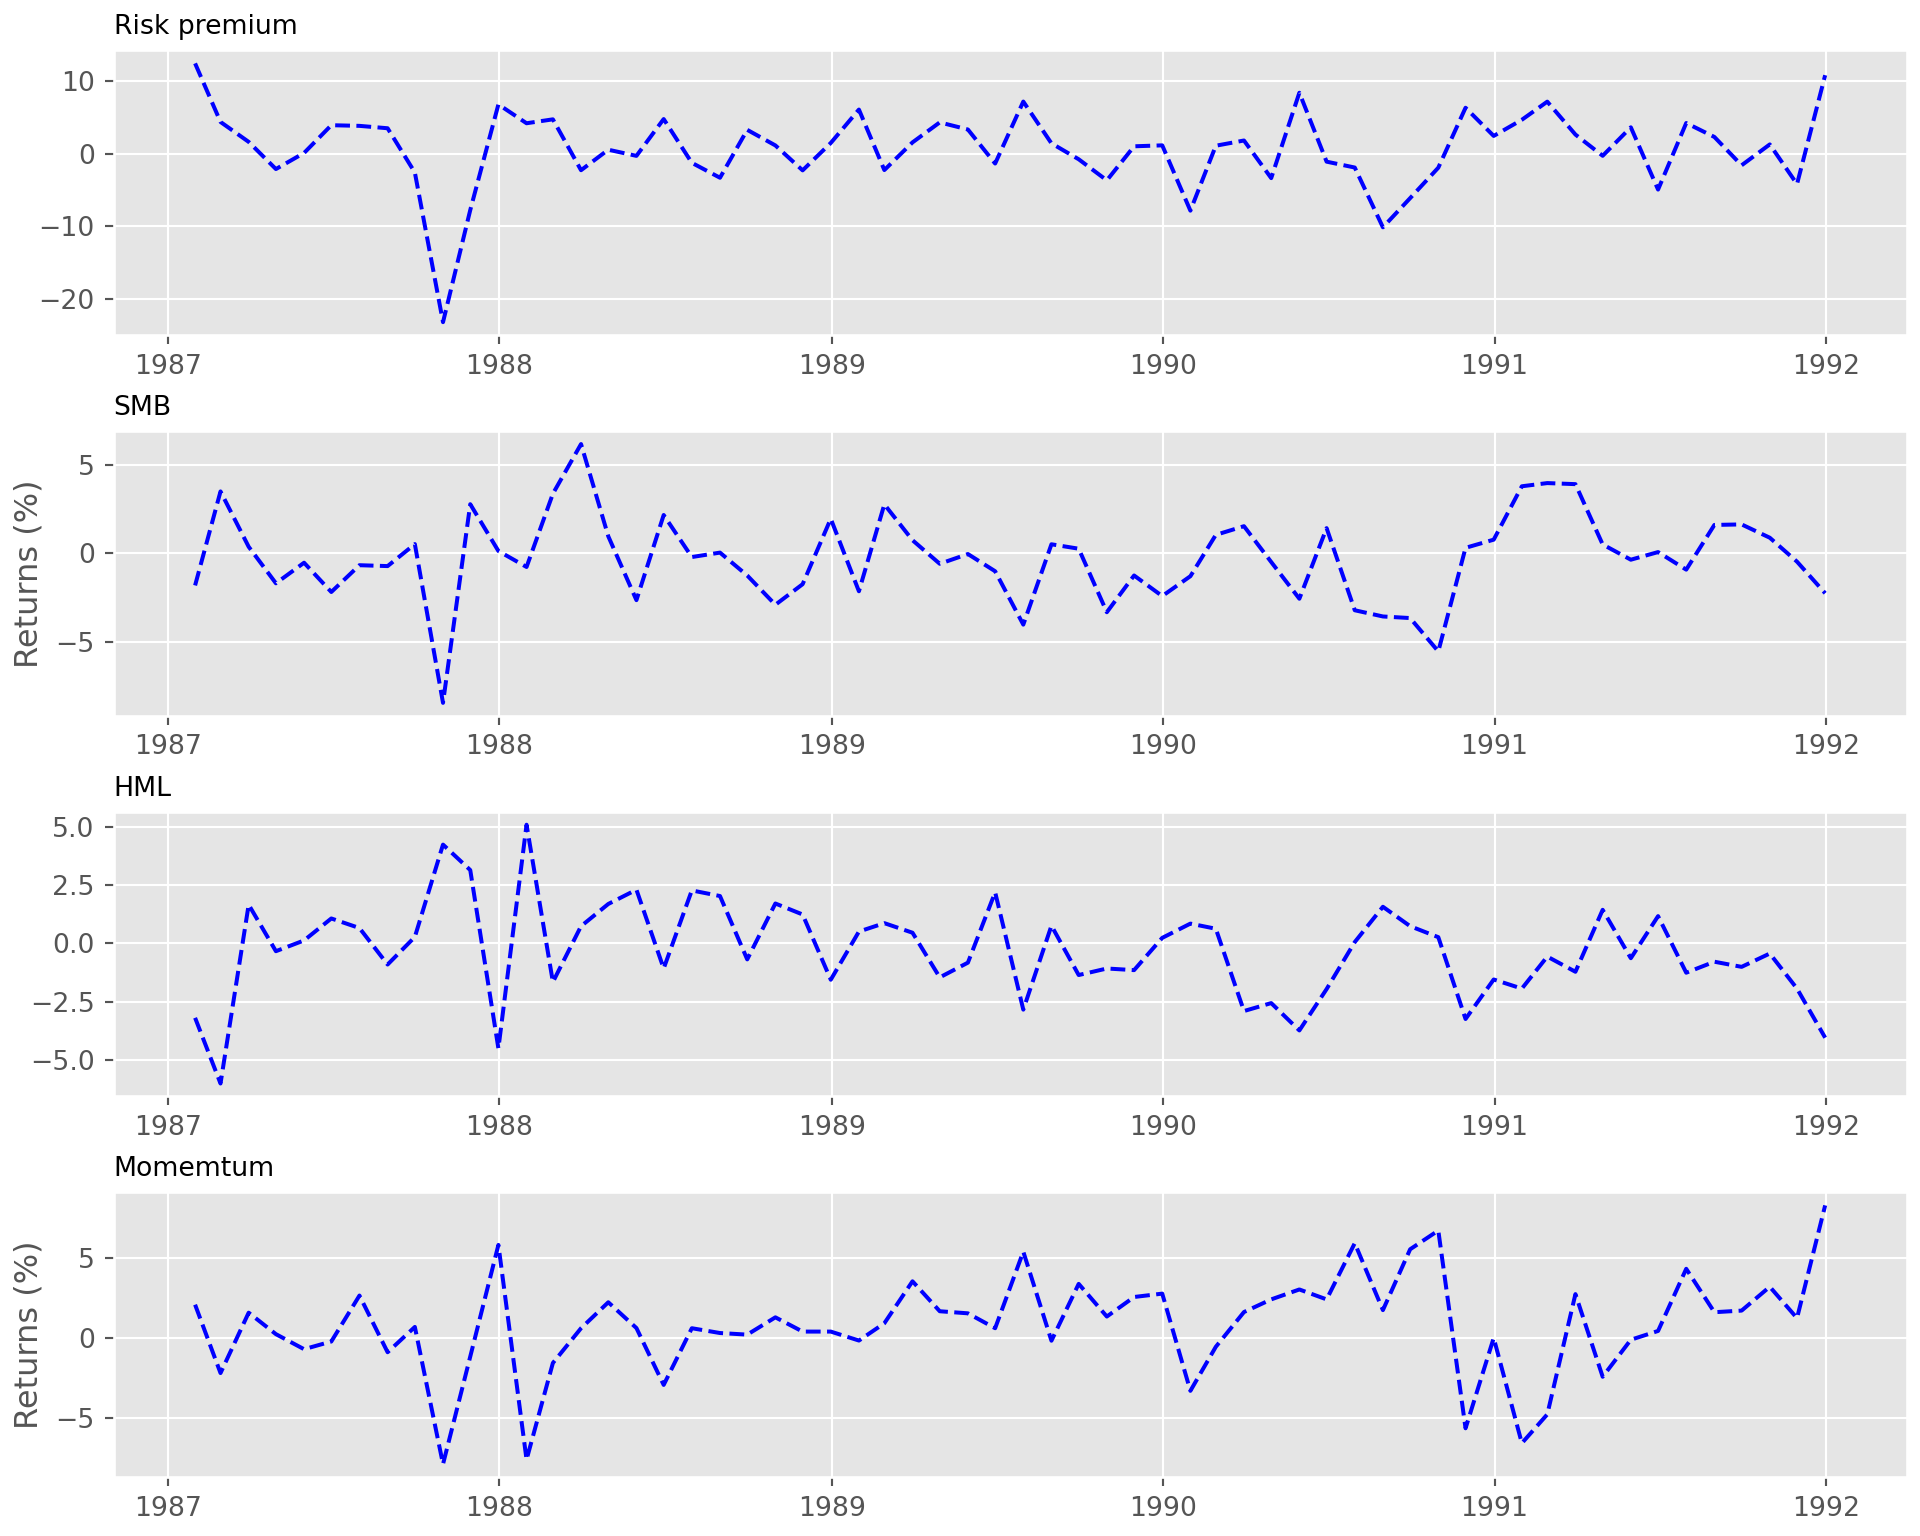
We’re taking a short break from neural networks to return to portfolio optimization. Our last posts in the portfolio series discussed risk-constrained optimization. Before that we examined satisificing vs. mean-variance optimization (MVO). In our last post on that topic, we simulated 1,000 60-month (5-year) return series using the 1987-1991 period ...
[Read more...]

Netting income

September 14, 2021 | R on OSM

For fundamental equity investors, the financial statement is the launchpad for the search for value. True, quants use financial statements too. But they spend less time on what the numbers mean, than on what they are. To produce a financial statement that adequately captures the economic (not GAAP or IFRS) ...
[Read more...]

Trees and networks

May 20, 2021 | R on OSM

It’s been over a month since our last post and for that we must apologize. We endeavor to be more prolific, but sometimes work and life get in the way. On the work front, let’s just say we won’t have to spend as much time selling encyclopedias ...
[Read more...]

Not so soft softmax

April 1, 2021 | R on OSM

Our last post examined the correspondence between a logistic regression and a simple neural network using a sigmoid activation function. The downside with such models is that they only produce binary outcomes. While we argued (not very forcefully) that if investing is about assessing the probability of achieving an attractive ...
[Read more...]

Activate sigmoid!

March 11, 2021 | R on OSM

In our last post, we introduced neural networks and formulated some of the questions we want to explore over this series. We explained the underlying architecture, the basics of the algorithm, and showed how a simple neural network could approximate the results and parameters of a linear regression. In this ...
[Read more...]

Nothing but (neural) net

February 25, 2021 | R on OSM

We start a new series on neural networks and deep learning. Neural networks and their use in finance are not new. But are still only a fraction of the research output. A recent Google scholar search found only 6% of the articles on stock price price forecasting discussed neural networks.1 Artificial ...
[Read more...]

Risk-constrained optimization

February 4, 2021 | R on OSM

Our last post parsed portfolio optimization outputs and examined some of the nuances around the efficient frontier. We noted that when you start building portfolios with a large number of assets, brute force simulation can miss the optimal weighting scheme for a given return or risk profile. While optimization finds ...
[Read more...]

Parsing portfolio optimization

January 30, 2021 | R on OSM

Our last few posts on risk factor models haven’t discussed how we might use such a model in the portfolio optimization process. Indeed, although we’ve touched on mean-variance optimization, efficient frontiers, and maximum Sharpe ratios in this portfolio series, we haven’t discussed portfolio optimization and its outputs ...
[Read more...]

More factors, more variance…explained

January 14, 2021 | R on OSM

Risk factor models are at the core of quantitative investing. We’ve been exploring their application within our portfolio series to see if we could create such a model to quantify risk better than using a simplistic volatility measure. That is, given our four portfolios (Satisfactory, Naive, Max Sharpe, and ...
[Read more...]

Explaining variance

December 13, 2020 | R on OSM

We’re returning to our portfolio discussion after detours into topics on the put-write index and non-linear correlations. We’ll be investigating alternative methods to analyze, quantify, and mitigate risk, including risk-constrained optimization, a topic that figures large in factor research. The main idea is that there are certain risks ...
[Read more...]

Round about the kernel

November 11, 2020 | R on OSM

In our last post, we took our analysis of rolling average pairwise correlations on the constituents of the XLI ETF one step further by applying kernel regressions to the data and comparing those results with linear regressions. Using a cross-validat...
[Read more...]

Kernel of error

October 25, 2020 | R on OSM

In our last post, we looked at a rolling average of pairwise correlations for the constituents of XLI, an ETF that tracks the industrials sector of the S&P 500. We found that spikes in the three-month average coincided with declines in the under...
[Read more...]

Corr-correlation

October 8, 2020 | R on OSM

We recently read two blog posts from Robot Wealth and FOSS Trading on calculating rolling pairwise correlations for the constituents of an S&P 500 sector index. Both posts were very interesting and offered informative ways to solve the problem using different packages in R: tidyverse or xts. We’ll use ...
[Read more...]
1 2 3 6

Never miss an update!
Subscribe to R-bloggers to receive
e-mails with the latest R posts.
(You will not see this message again.)

Click here to close (This popup will not appear again)