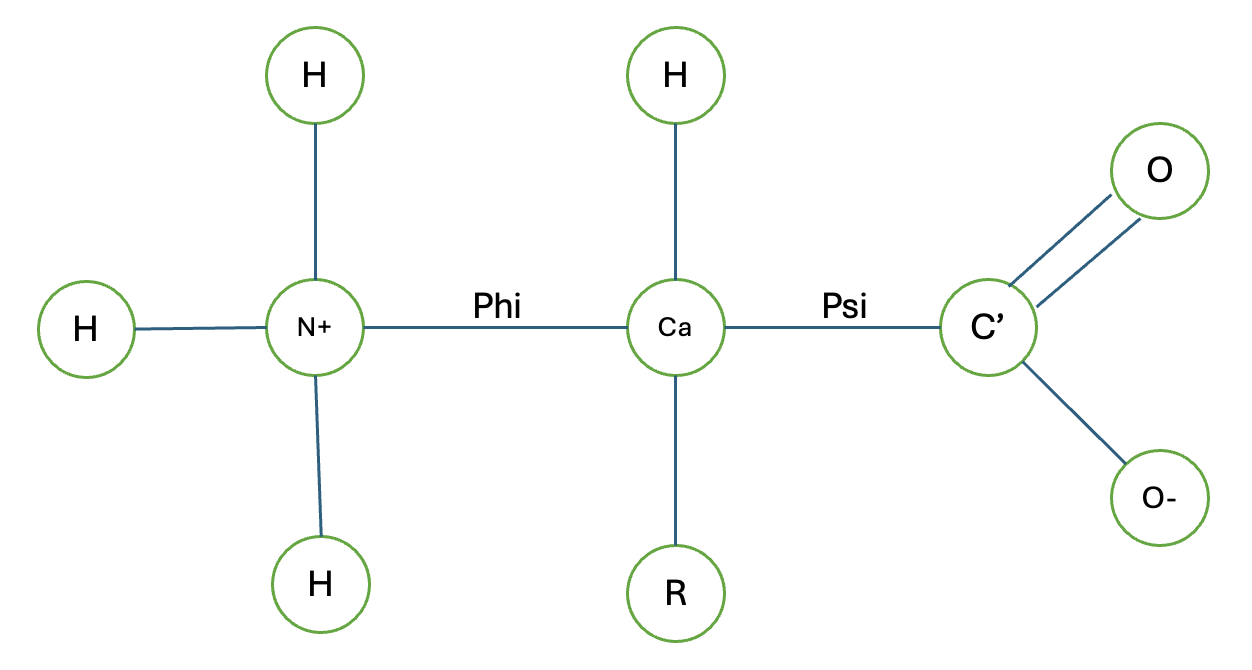
Twenty Questions and Decision Trees

November 22, 2025 | Jerry Tuttle

      Most of us have probably played the game Twenty Questions. The answerer chooses something, and the other players try to guess it by asking yes or no questions. The TV show "What's My Line" is an example of this wher...
[Read more...]

Data Science Quiz For Humanities

November 21, 2025 | Ponne, Bruno

Test your skills with this interactive data science quiz covering statistics, Python, R, and data analysis. Progress Answered 0 of 15 1Which of the following best describes a z-score? A measure of central tendency The number of standard deviations a value is from the mean The square of the correlation coefficient A ... [Read more...]

Flags

November 21, 2025 | Michael

Colors of Youth !! – CC BY-NC-ND by Rahul Sheel Day 21-22 of 30DayMapChallenge: « Icons » & « Natural Earth » (previously). The world as flags… Data # install.packages("grImport2") # install.packages("ggflags", #...
[Read more...]

Acidification

November 19, 2025 | Michael

Coral bleaching at Heron Island – CC BY by The Ocean Agency / XL Catlin Seaview Survey / Richard Vevers Day 20 of 30DayMapChallenge: « Water » (previously). Global ocean acidification mean sea water pH trend map from Multi-Observ...
[Read more...]

EPSG:3035

November 18, 2025 | Michael

Michalská brána (second take) – CC BY-SA by Alexandre Duret-Lutz Day 19 of 30DayMapChallenge: « Projections » (previously). EPSG:3035 is a Lambert azimuthal equal-area projection used for mapping Europe at medium scale, preservin...
[Read more...]

Perseverance

November 18, 2025 | Michael

Mars Perseverance Sol 1681: Right Mastcam-Z Camera – PD by NASA/JPL-Caltech/ASU Day 18 of 30DayMapChallenge: « Out of this world » (previously). Perseverance is still hiking… library(dplyr) library(sf) library(ggplot2) libr...
[Read more...]

Maplibre

November 17, 2025 | Michael

Heatmap of the french population Day 17 of 30DayMapChallenge: « A new tool » (previously). Testing Maplibre with {mapgl}. library(dplyr) library(mapgl) library(sf) Data Using french communes population. pop st_centroid() |__ select(population) Map maplibre(center = c(5, 45), zoom = 6) |__ add_heatmap_layer( id = "pop", source = pop, heatmap_weight = interpolate( column = "population", values = ...
[Read more...]

{talib}: Candlestick Pattern Recognition in R

November 16, 2025 | Serkan Korkmaz

{talib} is a new R-package for Technical Analysis (TA) and Candlestick Pattern Recognition (Yeah, the patterns traders bet their lifesavings on….). In this post I will show basic example on how {talib} works, and how it compares performance-wise with {TTR}. Basic example In this example I will identify all ‘Harami’ ...
[Read more...]

How to access HomeAssistant’s InfluxDB from R

November 15, 2025 | rstats-tips.net

I’m running a HomeAssistant instance at home. I’ve configured it to log data into an InfluxDB database, so I can retrieve historical data for analysis later on. In default mode HomeAssistant would aggregate historical data for storage reasons. So now I want to access the InfluxDB database from ... [Read more...]

MODIS fire

November 15, 2025 | Michael

Eagle Creek Fire – CC-BY-NC-SA by Curtis Gregory Perry Day 15 of 30DayMapChallenge: « Fire » (previously). An animation of global fires in 2024 using MODIS data. library(dggridR) library(dplyr) library(readr) library(ggplot...
[Read more...]
1 2 3 2,205