23 RStudio Tips, Tricks, and Shortcuts
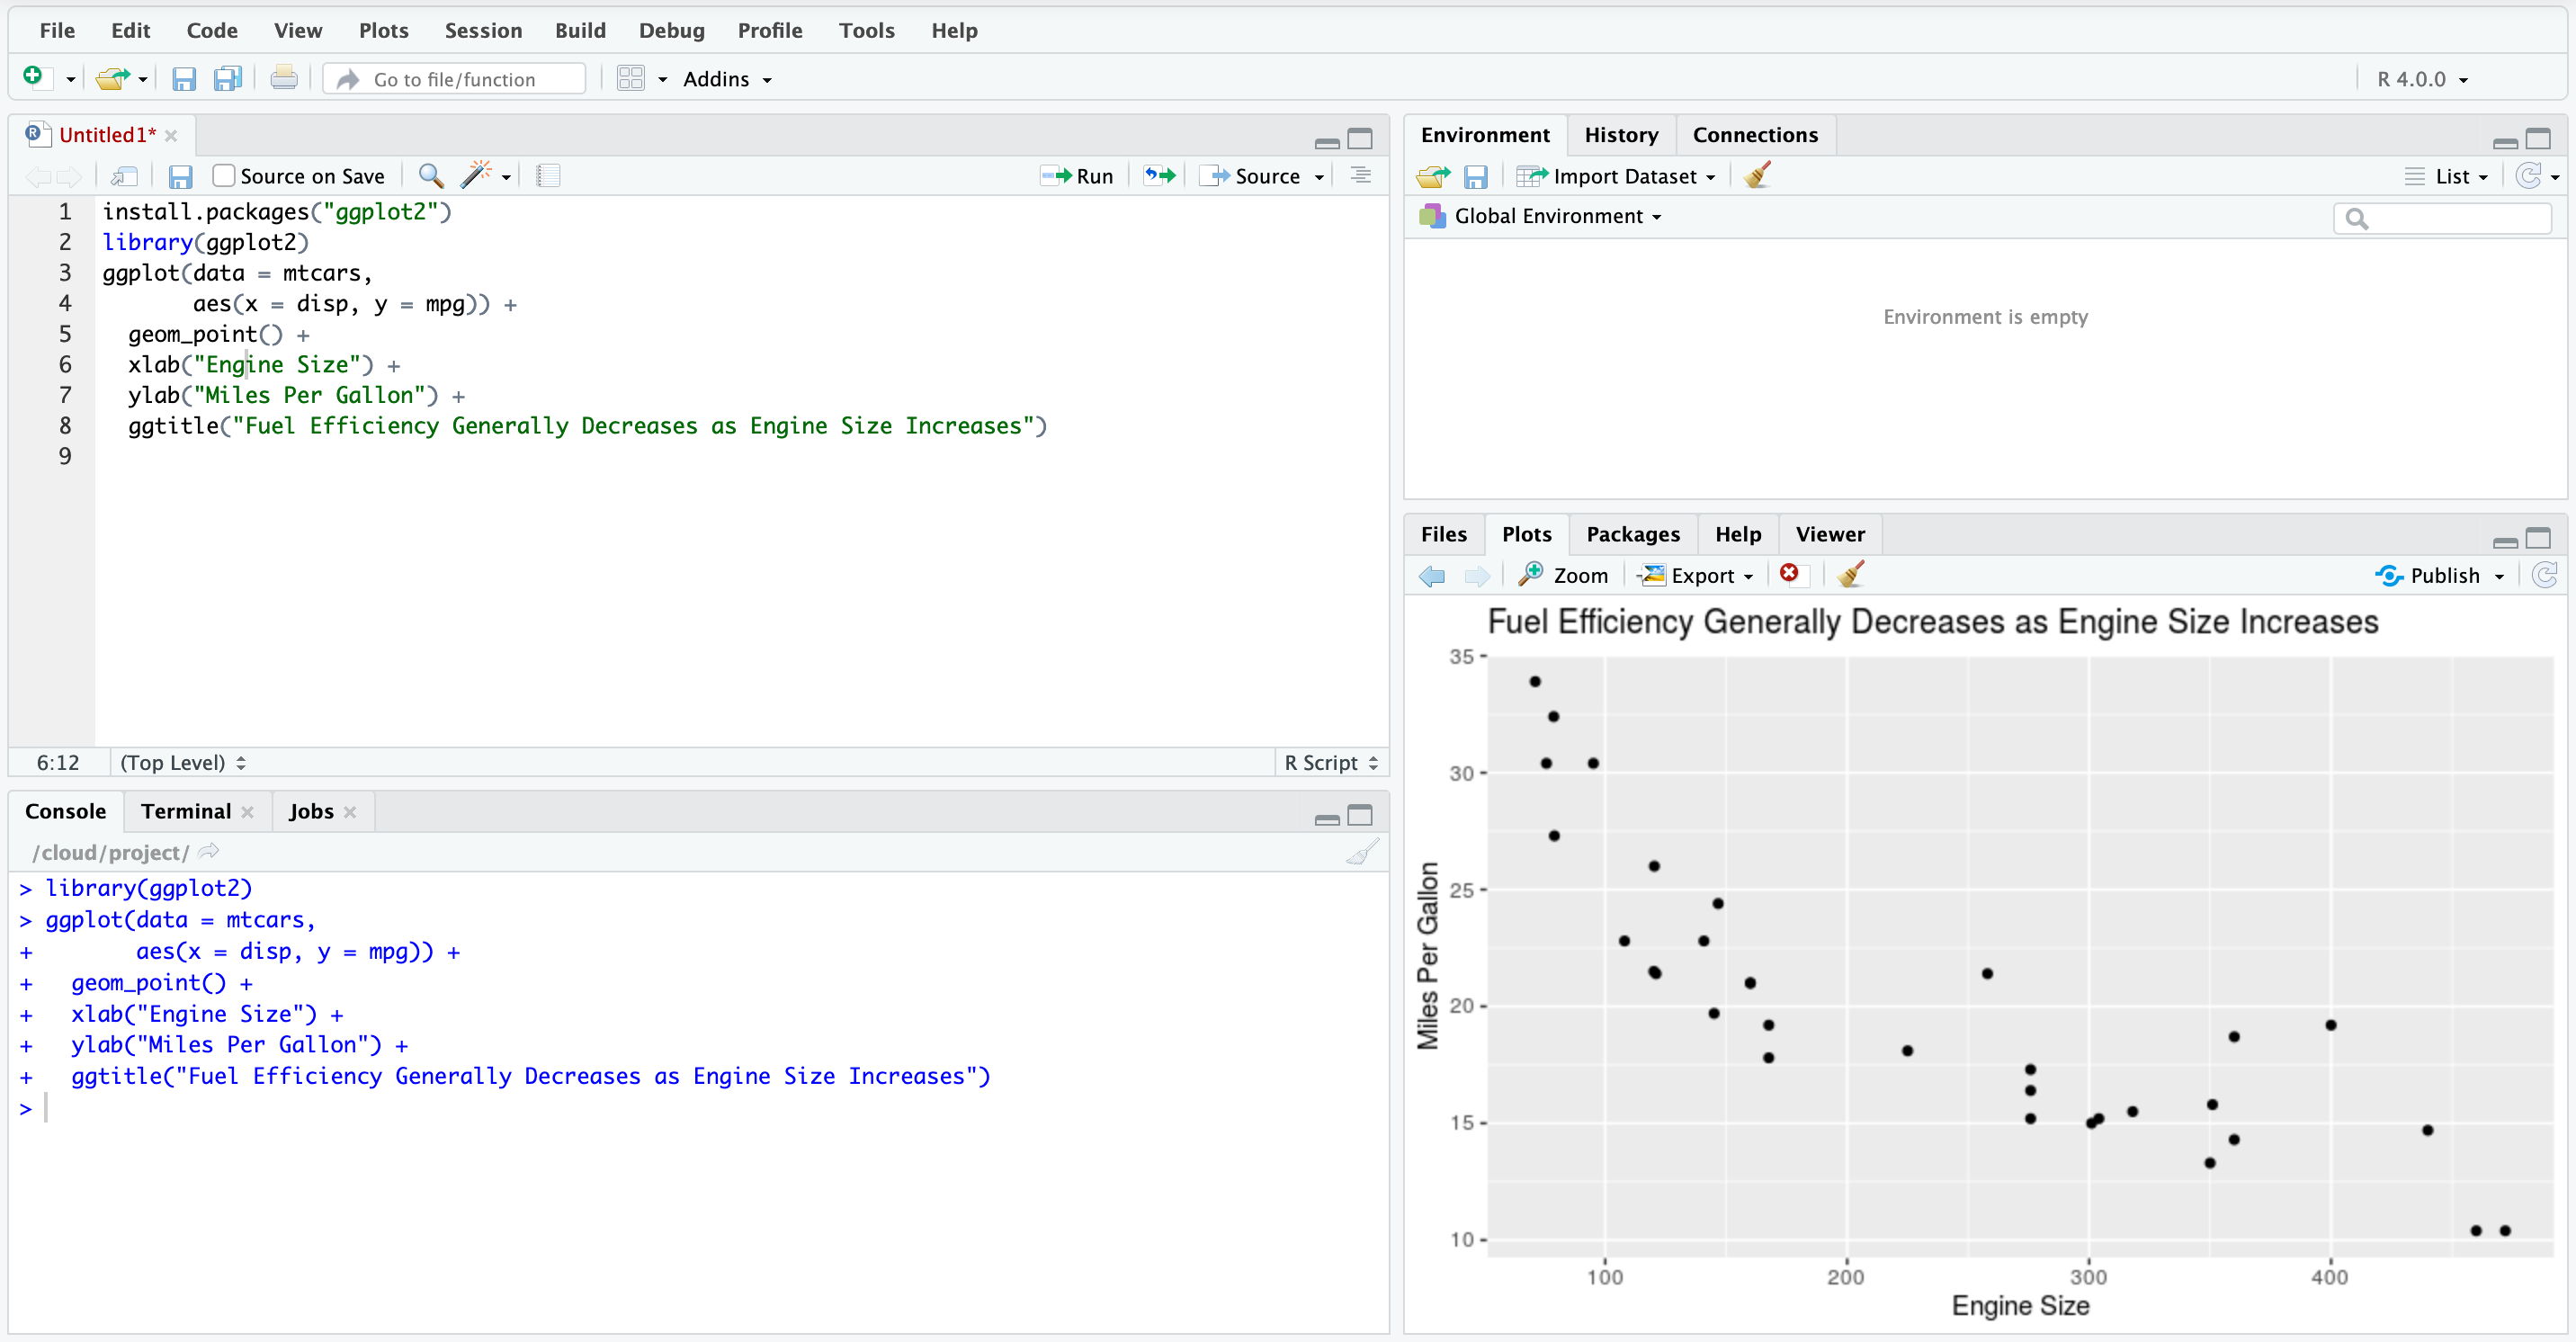
RStudio is a powerful tool for data analysis. Here are 23 tips, tricks, and shortcuts to turn you into an RStudio power user!
The post 23 RStudio Tips, Tricks, and Shortcuts appeared first on Dataquest.


Copyright © 2022 | MH Corporate basic by MH Themes