October 2019

RcppArmadillo 0.9.800.1.0

October 9, 2019 | Thinking inside the box

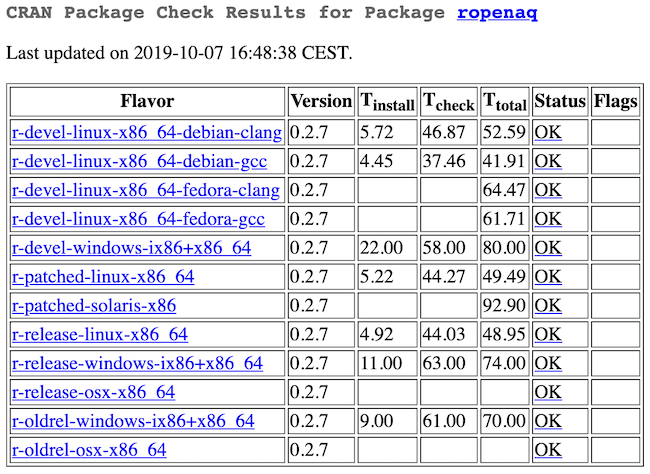
Another month, another Armadillo upstream release! Hence a new RcppArmadillo release arrived on CRAN earlier today, and was just shipped to Debian as well. It brings a faster solve() method and other goodies. We also switched to the (awesome) tinyte... [Read more...]

Twitter data analysis in R

October 9, 2019 | Francisco de Abreu e Lima

In many regards, this post will be very different from previous entries. While the focus is the usual R-based statistical analysis, data collection is also discussed in depth and this in turn begs for basic Unix / macOS terminal commands. MS Windows users can refer to VirtualBox or Ubuntu installations. In ...
[Read more...]

Mediation, confounding, and measurement error

October 9, 2019 | Kristoffer Magnusson

Mediation might be the ultimate example of how a method continues to be used despite a vast number of papers and textbooks describing the extremely strong assumptions required to estimate unbiased effects. My aim with this post is not to show some fancy method that could help reduce bias; rather ...
[Read more...]

rBokeh – Tipps and Tricks with JavaScript and beyond!

October 9, 2019 | Matthias Nistler

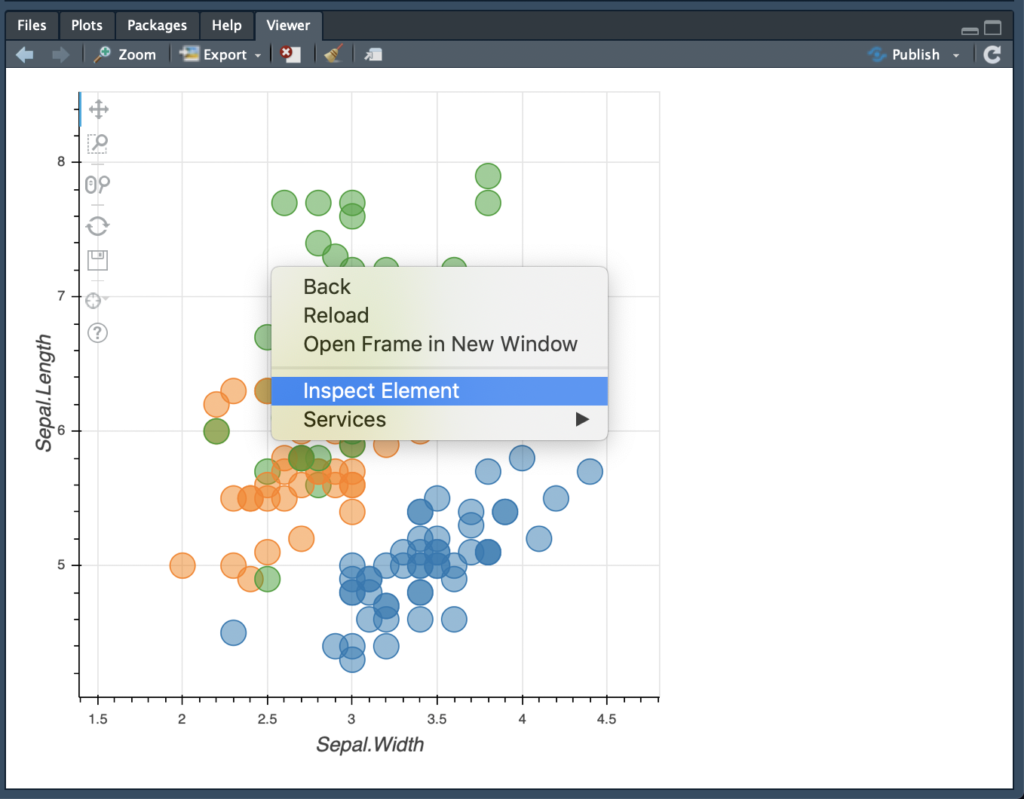
rBokeh is an interactive plotting library. It has the capability to extend its features with customized JavaScript code. I show the most important aspects, guide through an example, and provide some useful tipps how to handle likely issues. Der Beitrag rBokeh – Tipps and Tricks with JavaScript and beyond! erschien zuerst ...
[Read more...]

Building Interactive World Maps in Shiny

October 8, 2019 | R Views

Florianne Verkroost is a PhD candidate at Nuffield College at the University of Oxford. With a passion for data science and a background in mathematics and econometrics. She applies her interdisciplinary knowledge to computationally address societal problems of inequality. In this post, I will show you how to create interactive ...
[Read more...]

Simple Tabulations Made Simple

October 8, 2019 | petermeissner

The {tabit} package This is a blog post announcing the brand new micro package {tabit} that just made it to CRAN. ???? Thanks to all CRAN people ???? Motivation {tabit} is a package that is about making simple tabulations simple. My motivation for... [Read more...]

Calling covered data

October 7, 2019 | R on OSM

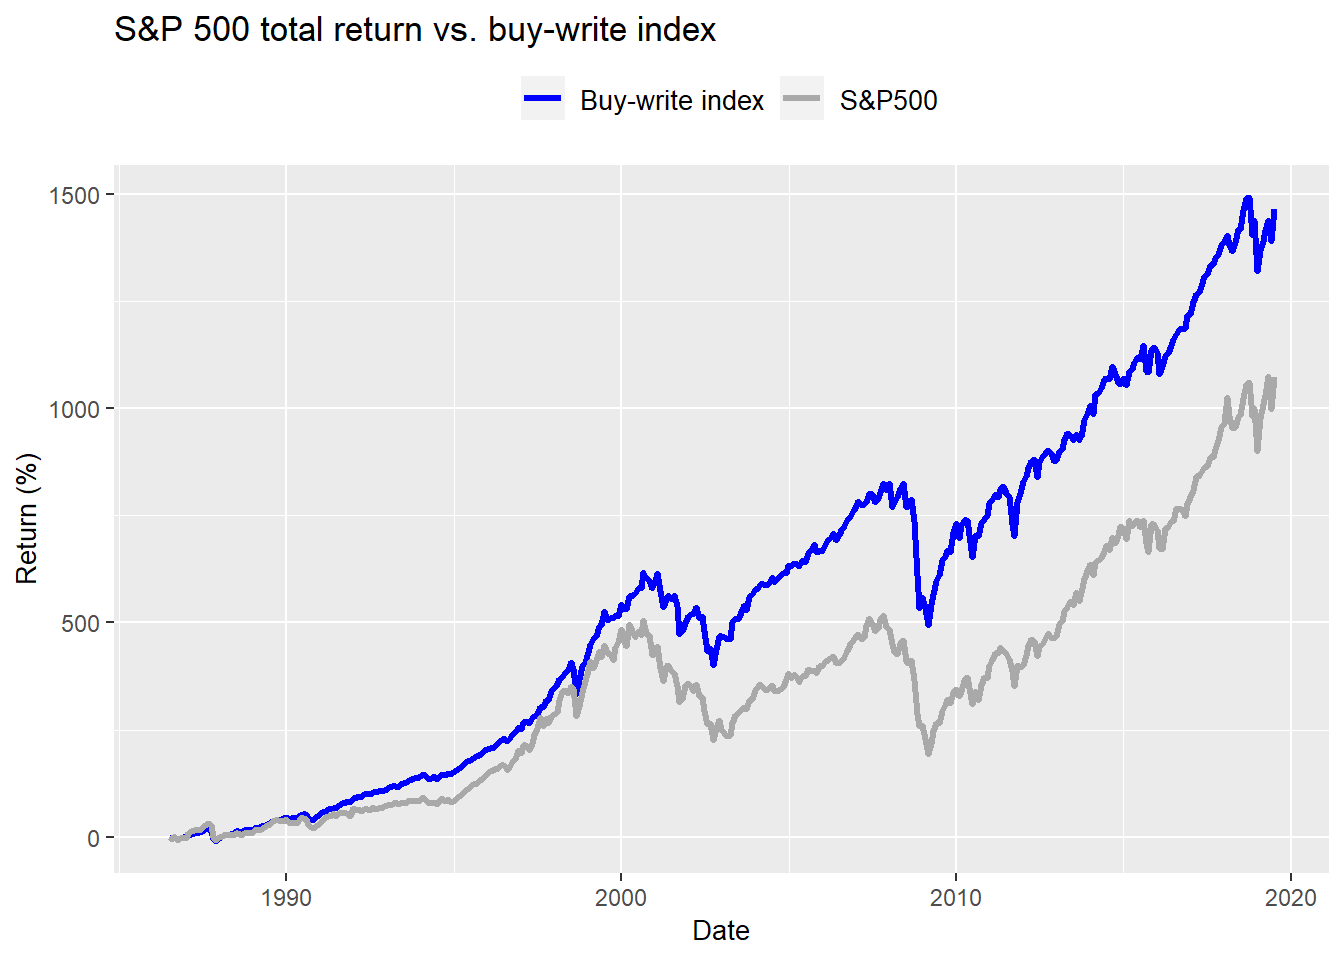
In our last post on covered calls we introduced the CBOE’s buy-write index (or BXM), whose underlying is the S&P500 index. We looked at some of the historical data, made a few comparisons between the index and the S&P, and noted that there was a report that ...
[Read more...]

Data Pivoting with tidyr

October 7, 2019 | Rstats on pi: predict/infer

Reshaping data from long to wide format, or wide to long format, is a common task in data science. Until recently, the best functions for performing this task in R were the gather and spread functions from the tidyr package. However, these functions had limitations, such as only being able ... [Read more...]

Use mfcol to have plots drawn by column

October 7, 2019 | kjytay

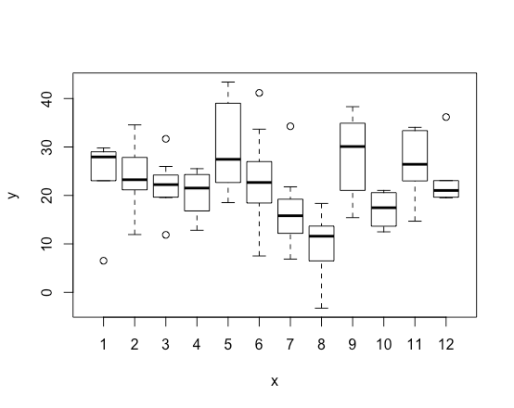
To plot multiple figures on a single canvas in base R, we can change the graphical parameter mfrow. For instance, the code below tells R that subsequent figures will by drawn in a 2-by-3 array: If we then run this … Continue reading →
[Read more...]
1 7 8 9 10 11 12

Never miss an update!
Subscribe to R-bloggers to receive
e-mails with the latest R posts.
(You will not see this message again.)

Click here to close (This popup will not appear again)