April 2019

Quick Example of Latent Profile Analysis in R

April 19, 2019 | R on Will Hipson

Latent Profile Analysis (LPA) tries to identify clusters of individuals (i.e., latent profiles) based on responses to a series of continuous variables (i.e., indicators). LPA assumes that there are unobserved latent profiles that generate patterns of responses on indicator items. Here, I will go through a quick example ...
[Read more...]

Control Charts Another Package

April 19, 2019 | Analysis of AFL

I got an email from Alex Zanidean, who runs the xmrr package “You might enjoy my package xmrr for similar charts – but mine recalculate the bounds automatically” and if we go to the vingette, “XMRs combine X-Bar control charts and Moving Range control charts. These functions also will recalculate the ...
[Read more...]

Happy EasteR! Let’s find some eggs…

April 19, 2019 | Jurriaan Nagelkerke

It's Easter Time! Let's find some eggs... Hi there! Yes, it's the most Easterful time of the year again. For some of us a sacret time, for others mainly an egg-eating period and some just enjoy the extra day of spare time. In case you have some time available for ... [Read more...]

ODSC East 2019 Talks to Expand and Apply R Skills

April 19, 2019 | Open Data Science ODSC Team

R programmers are not necessary data scientists, but rather software engineers. We have an entirely new multitrack focus area that helps engineers learn AI skills – AI for Engineers. This focus area is designed specifically to help programmers get familiar with AI-driven software that utilizes deep learning and machine learning models ... [Read more...]

tint 0.1.2: Some cleanups

April 19, 2019 | Thinking inside the box

A new version 0.1.2 of the tint package is arriving at CRAN as I write this. It follows the recent 0.1.1 release which included two fabulous new vignettes featuring new font choices. The package name expands from tint is not tufte as the package offe... [Read more...]

Using ecmwfr to measure global warming

April 18, 2019 | Code R

For my research I needed to download gridded weather data from ERA-Interim, which is a big dataset generated by the ECMWF. Getting long term data through their website is very time consuming and requires a lot of clicks. Thankfuly, I came accross th...
[Read more...]

A Short R Package Review: RQDA

April 18, 2019 | Martin Chan

A favourite R package? Whenever I’m asked the question of what my favourite R package is, I often go through this reasoning: tidyverse packages, such as dplyr and tidyr, are what I’d call “essentials” i.e. packages that I would always load for almost every piece of analysis ...
[Read more...]

Using ecmwfr to measure global warming

April 18, 2019 | Code R

For my research I needed to download gridded weather data from ERA-Interim, which is a big dataset generated by the ECMWF. Getting long term data through their website is very time consuming and requires a lot of clicks. Thankfuly, I came accross the nifty ecmwfr R package that allowed me ...
[Read more...]

Metadata : from PostgreSQL comments to R labels

April 18, 2019 | Michael

Metadata are an essential part of a robust data science workflow ; they record the meaning of each variable : its units, quality, allowed range, how we collect it, when it’s been recorded etc. Data without metadata are practically worthless. Here we will show how to transfer the metadata from PostgreSQL ... [Read more...]

Thoughts on SatRday Newcastle

April 18, 2019 | Rhian Davies

Earlier this month I attended the inaugural SatRday Newcastle. This was my first time attending a SatRday event, and I had a really enjoyable day. The event was sponsored by Newcastle University, Sage, RStudio and Jumping Rivers. There were over 100 attendees from across the U.K. Most attendees were from ...
[Read more...]

A Comparative Review of the JASP Statistical Software

April 17, 2019 | Bob Muenchen

JASP is a free and open source statistics package that targets beginners looking to point-and-click their way through analyses. This article is one of a series of reviews which aim to help non-programmers choose the Graphical User Interface (GUI) for R, which best meets their needs. Continue reading →
[Read more...]

Yield curve predictions twist my noodle

April 17, 2019 | R on OSM

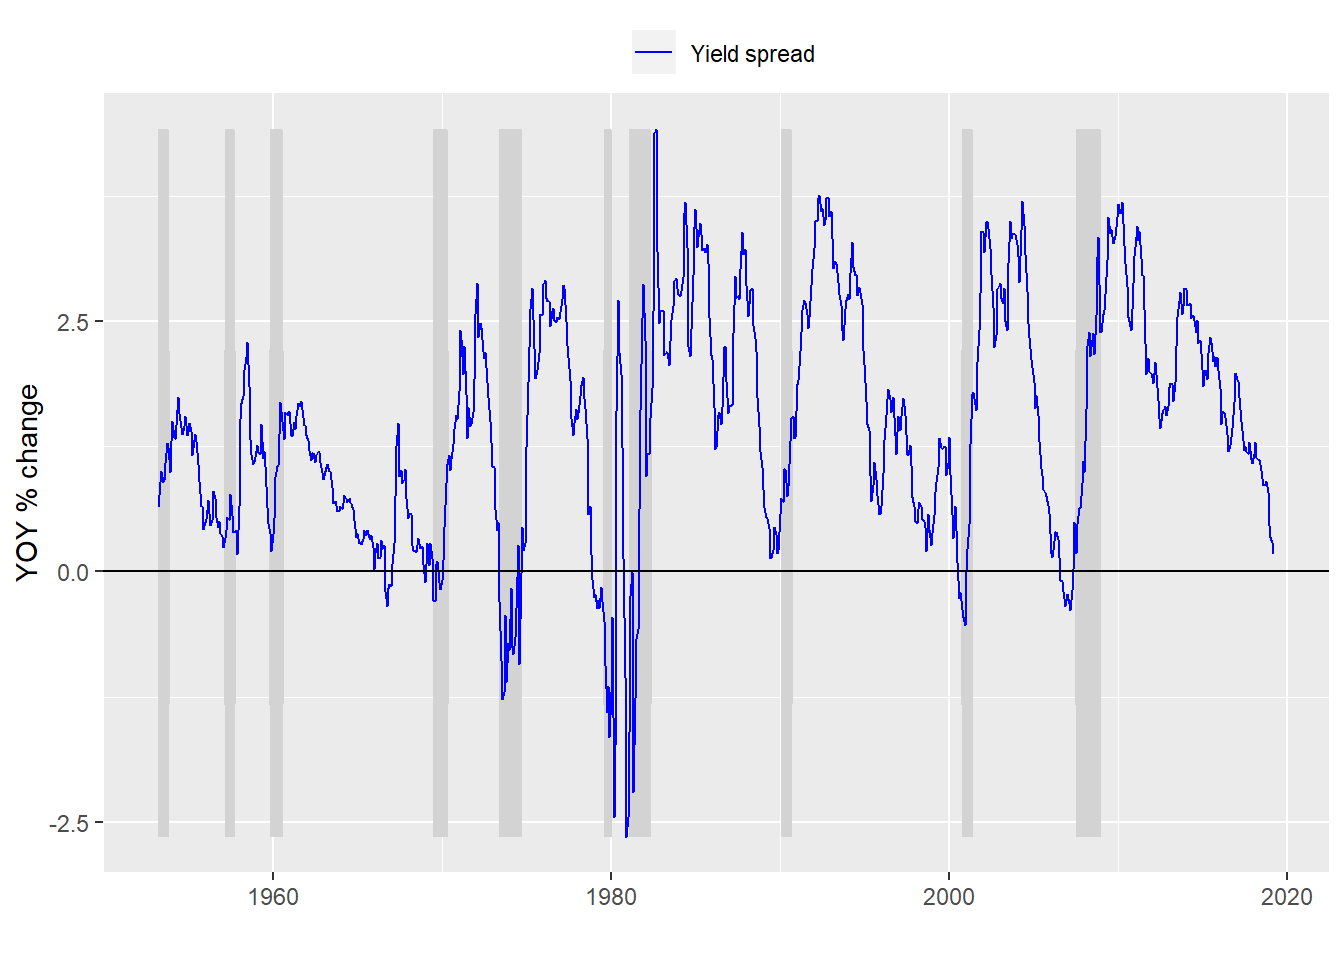
Where did we go wrong? Not another model! As we saw in the last post, one iteration of the yield curve – the spread between 10-year and 3-month Treasuries – doesn’t generate a great model of recession probabilities. Part of this is that recessio...
[Read more...]

Yield curve predictions twist my noodle

April 17, 2019 | R on OSM

Where did we go wrong? Not another model! As we saw in the last post, one iteration of the yield curve – the spread between 10-year and 3-month Treasuries – doesn’t generate a great model of recession probabilities. Part of this is that recessions are not that common, so we’re ...
[Read more...]

ANCOVA Example

April 17, 2019 | Posts on R Lover ! a programmer

Analysis of covariance (ANCOVA) using R. I recently had the need to run an ANCOVA, not a task I perform all that often and my first time using R to do so (I’ve done it in SPSS and SAS before). Having a decent theoretical idea of what I had ...
[Read more...]

Edit datatables in R shiny app

April 17, 2019 | Senthil Thyagarajan

Tables are very much the standard way of representing data in dashboard along with visualizations. Wouldnt it be more useful if you could edit the values in the tables to trigger some calculations and update the values on the fly . These can be used for adjusting allocations or budgets in ... [Read more...]
1 4 5 6 7 8 15

Never miss an update!
Subscribe to R-bloggers to receive
e-mails with the latest R posts.
(You will not see this message again.)

Click here to close (This popup will not appear again)