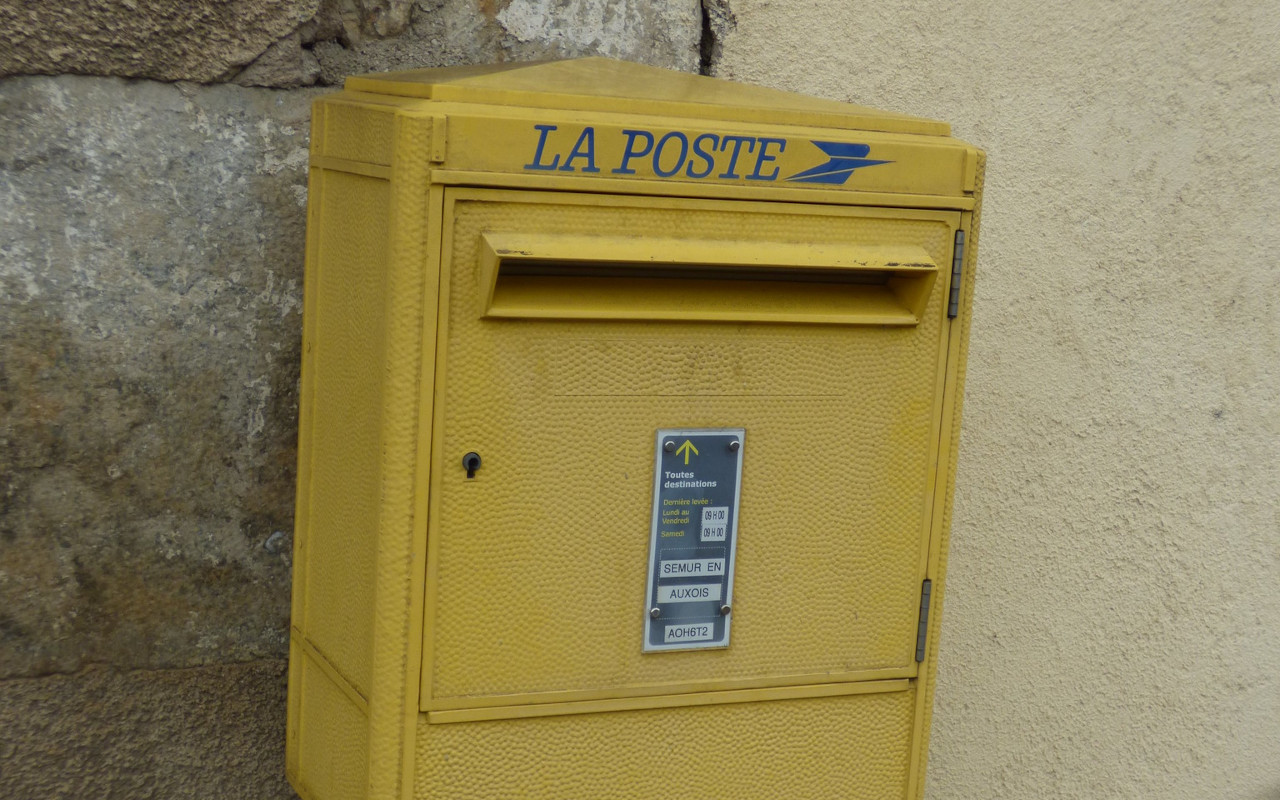
Articles by Michael

Simplifying polygons layers

October 15, 2021 | Michael

The current 2021 french administrative limits database (Adminexpress from IGN) is more detailed than the original version (from 50 MB zipped in 2017 to 500 MB zipped now), thanks to a more detailed geometry being currently based on the BDTOPO. However we don’t always need large scale details especially for web applications. The ... [Read more...]

Does 100 m equal 1 km ?

September 15, 2021 | Michael

Photo : Alexis Martín In trail running or orienteering people say that if you have to run 100 m of elevation up and down it would take the same time as running flat for 1000 m. We can find a similar old rule of thumb and more recently, some researchers (Davey, Hayes & ... [Read more...]

Playing with Roman numerals

December 25, 2020 | Michael

What is the longest year number (yet) written in Roman numerals ? It is year 1888, with 13 characters… And the largest writable number being 3899, according to the strict rules in R (however some say it’s 3999), the longest overall year will be year 3888 with 15 characters. Nice pattern : And there are […] [Read more...]

Trail running : is it worth starting?

August 10, 2020 | Michael

https://www.flickr.com/photos/alexismarod/33815546074/ Trail running can be hard. During one, I was wondering if we can avoid the race completely and predict the race time according to distance, elevation change, sex and performance index (so yes, we have to run sometimes to measure it). We need a ...
[Read more...]

Using the geofacet package to spatially arrange plots

June 15, 2020 | Michael

The {geofacet} package allows to « arrange a sequence of plots of data for different geographical entities into a grid that strives to preserve some of the original geographical orientation of the entities ». Like the previous post, it’s interesting if you view each entity as a unit and don’t ... [Read more...]

Polygons to hexagons

May 26, 2020 | Michael

Hexagon tessellation using the great geogrid package. The départements are the second level of administrative government in France. They neither have the same area nor the same population and this heterogeneity provides a few challenges for a fair and accurate map representation (see the post on smoothing). However if ... [Read more...]

Europe COVID-19 death map

May 2, 2020 | Michael

COVID-19 deaths in Europe# Europe COVID-19 deaths animated map # http://r.iresmi.net/ # data European Centre for Disease Prevention and Control # packages ---------------------------------------------------------------- library(tidyverse) library(httr) library(fs) library(sf) library(readxl) library(janitor) library(glue) library(tmap) library(grid) library(classInt) library(magick) # + btb, raster, fasterize, plyr # sources ... [Read more...]

COVID-19 decease animation map

April 1, 2020 | Michael

Coronavirus decease in France# Animation carto décès COVID 19 France # avec lissage # sources ----------------------------------------------------------------- # https://www.data.gouv.fr/fr/datasets/donnees-hospitalieres-relatives-a-lepidemie-de-covid-19/ fichier_covid % group_by(dep) %__% summarise(deces = sum(dc, na.rm = TRUE), reanim = sum(rea, na.rm = TRUE), hospit = sum(hosp, na.rm = TRUE)), by = c("insee_... [Read more...]

Mauna Loa CO₂ polar plot

January 1, 2020 | Michael

After a classic plot (see our former post) used on Wikipedia, we can explore another data visualization. The CO₂ concentration, one of the main cause of the climate warming, is following a seasonal cycle so it could be interesting (or ironic ?) to use a polar plot. Config and data We ... [Read more...]

Metadata : from PostgreSQL comments to R labels

April 18, 2019 | Michael

Metadata are an essential part of a robust data science workflow ; they record the meaning of each variable : its units, quality, allowed range, how we collect it, when it’s been recorded etc. Data without metadata are practically worthless. Here we will show how to transfer the metadata from PostgreSQL ... [Read more...]

Open and merge multiple shapefiles

March 27, 2019 | Michael

or more precisely union many spatial tables in R in a tidy way. dplyr::bind_rows doesn’t work on sf objects ; base::rbind only work on two tables and so that’s not straightforward to use*. So we’ll use purrr::map and tidyr::unnest. First get some data, ... [Read more...]

Post to Mastodon from R

February 15, 2019 | Michael

Mastodon is a decentralized microblogging platform. We can analyse some data and directly post our findings to a Mastodon instance. For example we can plot the different TLDs used by the Mastodon Fediverse. Before posting we have to create an authorization token once. Login We can then post the created ... [Read more...]

Generate multiple language version plots

February 13, 2019 | Michael

The use case is to create the same plot in different languages. I used this technique for Wikipedia plots. We are going to build a list containing all translations, we will then loop over each language, generating and saving the plot. Our plots as a nice gallery : [Read more...]

Mapping multiple trends with confidence

February 6, 2019 | Michael

A tutorial to compute trends by groups and plot/map the results We will use dplyr::nest to create a list-column and will apply a model (with purrr::map) to each row, then we will extract each slope and its p-value with map and broom::tidy. Setup Data Map data. ... [Read more...]

Bibliography with knitr : cite your references and packages

February 2, 2019 | Michael

A tutorial to use your Zotero references with rmarkdown, easily add the references, automatically generate your bibliography, including the packages used in your document. It’s a good practice to cite the R packages you use in your analysis. However it can be cumbersome to maintain the list of your ... [Read more...]

Developing a user-friendly regular expression function (easyGregexpr)

May 4, 2010 | Michael

In the past few months, I've developed a set of functions for automating model estimation and interpretation using Mplus, an outstanding latent variable modeling program that has unparalleled flexibility for complex models (e.g., factor mixture models). I recently rolled these functions into an R package called MplusAutomation. Because the ... [Read more...]

Using MKL-Linked R in Eclipse

April 12, 2010 | Michael

Setting up Eclipse to use MKL-Linked RIn my previous post, I showed how to compile R 2.10.1 using Intel's Math Kernel Library for the BLAS/LAPACK interface. Even though it takes a bit of time to setup, I think the noticeably improved calculation speed justifies the effort. Although I'm happy to ... [Read more...]
1 2

Never miss an update!
Subscribe to R-bloggers to receive
e-mails with the latest R posts.
(You will not see this message again.)

Click here to close (This popup will not appear again)