Now that I've completed seven detailed reviews of Graphical User Interfaces (GUIs) for R, let's try to compare them. It's easy enough to count their features and plot them, so let's start there. Continue reading →
A rather blah number Le Monde mathematical puzzle: Find all integer multiples of 11111 with exactly one occurrence of each decimal digit.. Which I solved by brute force, by looking at the possible range of multiples (and borrowing stringr:str_count from Robin!) __ combien=0 __ for (i in 90001:900008){ j=i*11111 combien=combien+(...
Experiences with using R/exams for written exams in finance classes with a moderate number of students at Texas A&M International University (TAMIU).
Guest post by Nathaniel P. Graham (Texas A&M International University, Division of International Banking and Finance Studies).
Background
While R/exams was originally written for ... [Read more...]
I thought I would give a personal update on our book: Practical Data Science with R 2nd edition; Zumel, Mount; Manning 2019. The second edition should be fully available this fall! Nina and I have finished up through chapter 10 (of 12), and Manning has released previews of up through chapter 7 (with more ... [Read more...]
Today I am happy to announce a new free course: Help Your Team Learn R! Over the last few years I’ve helped a number of data teams train their analysts to use R. At each company there was a skilled R user who was leading the team’s effort ... [Read more...]
Biodiversity citizen scientists use iNaturalist to post their observations with photographs. The observations are then curated there by crowd-sourcing the identifications and other trait related aspects too. The data once converted to “research grade” is passed on to GBIF as occurrence records. Exciting news from India in 3rd week of ...
The idea of embedded plots for visualizing a large dataset that has an overplotting problem recently came up in some discussions with students. I first learned about embedded graphics from package ggsubplot. You can still see an old post about that package and about embedded graphics in general, with examples. ...
Great data science work should be reproducible. The ability to repeat
experiments is part of the foundation for all science, and reproducible work is
also critical for business applications. Team collaboration, project validation,
and sustainable products presuppose the ability to reproduce work over time.
In my opinion, mastering just a ...
A neat question from The Riddler on a multi-probability survival rate: Nine processes are running in a loop with fixed survivals rates .99,….,.91. What is the probability that the first process is the last one to die? Same question with probabilities .91,…,.99 and the probability that the last process is the last ...
After working on the MOB package, I received requests from multiple users if I can write a binning function that takes the weighting scheme into consideration. It is a legitimate request from the practical standpoint. For instance, in the development of fraud detection models, we often would sample down non-fraud ... [Read more...]
The Australian Election Study is an impressive long term research project that has collected the attitudes and behaviours of a sample of individual voters after each Australian federal election since 1987. All the datasets and documentation are freely ... [Read more...]
In this post, we will solve a simple problem (called “FizzBuzz”) that is asked by some employers in data scientist job interviews. The question seeks to ascertain the applicant’s familiarity with basic programming concepts. We will see 2 different ways to solve the problem in 2 different statistical programming languages: R ... [Read more...]
In this post, we will solve a simple problem (called "FizzBuzz") that is asked by some employers in data scientist job interviews. The question seeks to ascertain the applicant's familiarity with basic programming concepts. We will see 2 different ways to solve the problem in 2 different statistical programming languages: R and ... [Read more...]
Should we use magrittr pipes with data.table? Why ask the question? If you are fairly new to R, you might find it puzzling / intriguing that R questions on Stack Overflow tend to attract a range of solutions which all have different syntax “styles”, but almost all seem to be ...
Recap
In the last post, the discipline of event log and process mining were defined. The bupaR package was introduced as a technique to do process mining in R.
Objectives for This Post
Visualize workflow
Understand the concept of activity reoccurrences
We will use a pre-loaded dataset sepsis from the ... [Read more...]
Today, I am finally getting around to writing this very sad blog post: Before you take my DataCamp course please consider the following information about the sexual harassment scandal surrounding DataCamp!
As many of my fellow instructors and community... [Read more...]
After wrapping up the function batch_woe() today with the purpose to allow users to apply WoE transformations to many independent variables simultaneously, I have completed the development of major functions in the MOB package that can be usable for the model development in a production setting. The function batch_... [Read more...]
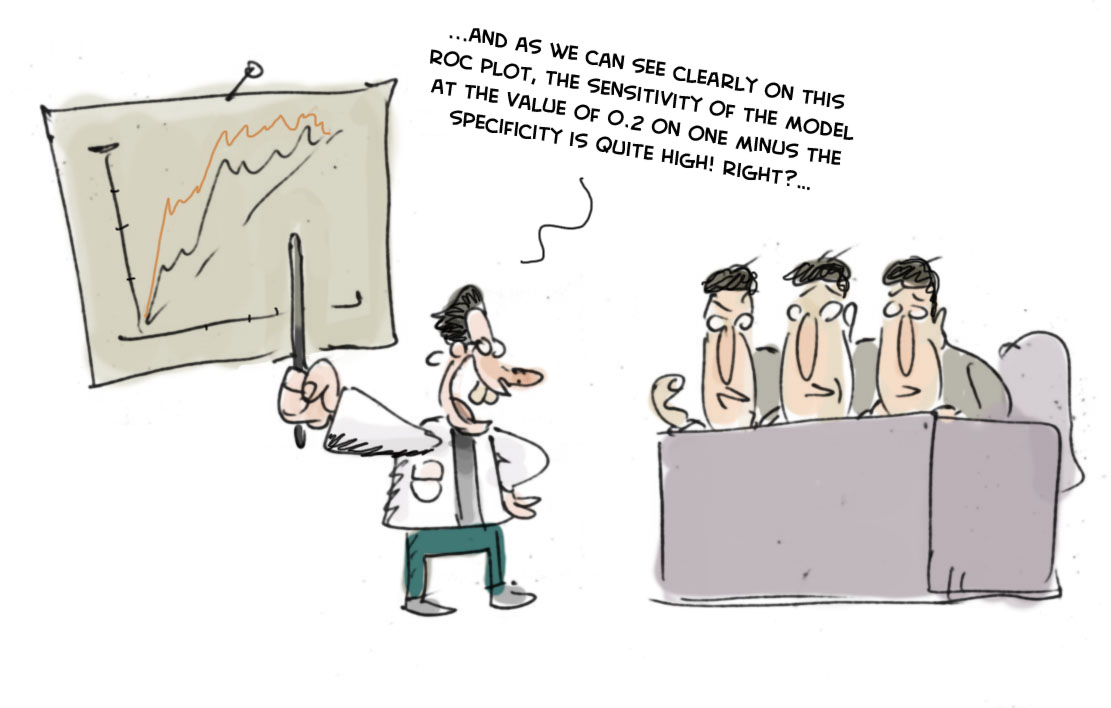
Why ROC curves are a bad idea to explain your model to business people
The modelplotr package makes it easy to create a number of valuable evaluation plots to assess the business value of a predictive model. Using these plots, it can be shown how implementation of the model will ...
Most of the shiny apps have tables as the primary component. Now lets say you want to prettify your app and style the tables. All you need understand how tables are built using HTML. This is how the default datatable looks like in the app.
In order to build the ... [Read more...]