December 2020

doc2vec in R

December 15, 2020 | Super User

Learn how to apply doc2vec in R on your text in this pdf presentation available at https://www.bnosac.be/index.php/blog/103-doc2vec-in-R. Where we focus on our R package doc2vec available at https://github.com/bnosac/doc2vec You can view the prese... [Read more...]

Why R? Foundation 2020-12-15 04:47:03

December 15, 2020 | Why R? Foundation

This Thursday, December 17th at 7 pm UTC, as part of the Why R? Webinar series, we will be delighted to host Paulito Palmes, a research scientist in IBM Research Europe. He will be speaking about combining utilities and workflows of R and Julia to so... [Read more...]

TIBCO’s COVID-19 Visual Analysis Hub: Under the Hood

December 15, 2020 | R Consortium

Originally published in the TIBCO Community Blog, by Adam Faskowitz TIBCO Spotfire is a unique platform that combines advanced visualization and data science techniques. The culmination of its capabilities can... The post TIBCO’s COVID-19 Visual Analysis Hub: Under the Hood appeared first on R Consortium.
[Read more...]

Visualizing age-sex composition of confirmed coronavirus cases in Eswatini over time

December 14, 2020 | Emmanuel ỌLÁMÍJÙWỌ́N

Introduction ???? Why visualize the age-sex composition of confirmed coronavirus cases? Demographers have been consistently highlighting the importance of age-sex structure of the population and confirmed cases in shaping fatality rates in countries (see these articles???? published in PNAS and PlosONE for details). My colleagues and I also wrote a commentary????... [Read more...]

Bootstrapping Time Series for Gold Rush

December 14, 2020 | Selcuk Disci

Bootstrap aggregating (bagging), is a very useful averaging method to improve accuracy and avoids overfitting, in modeling the time series. It also helps stability so that we don’t have to do Box-Cox transformation to the data. Modeling time series data is difficult because the data are autocorrelated. In this ...
[Read more...]

Explaining variance

December 13, 2020 | R on OSM

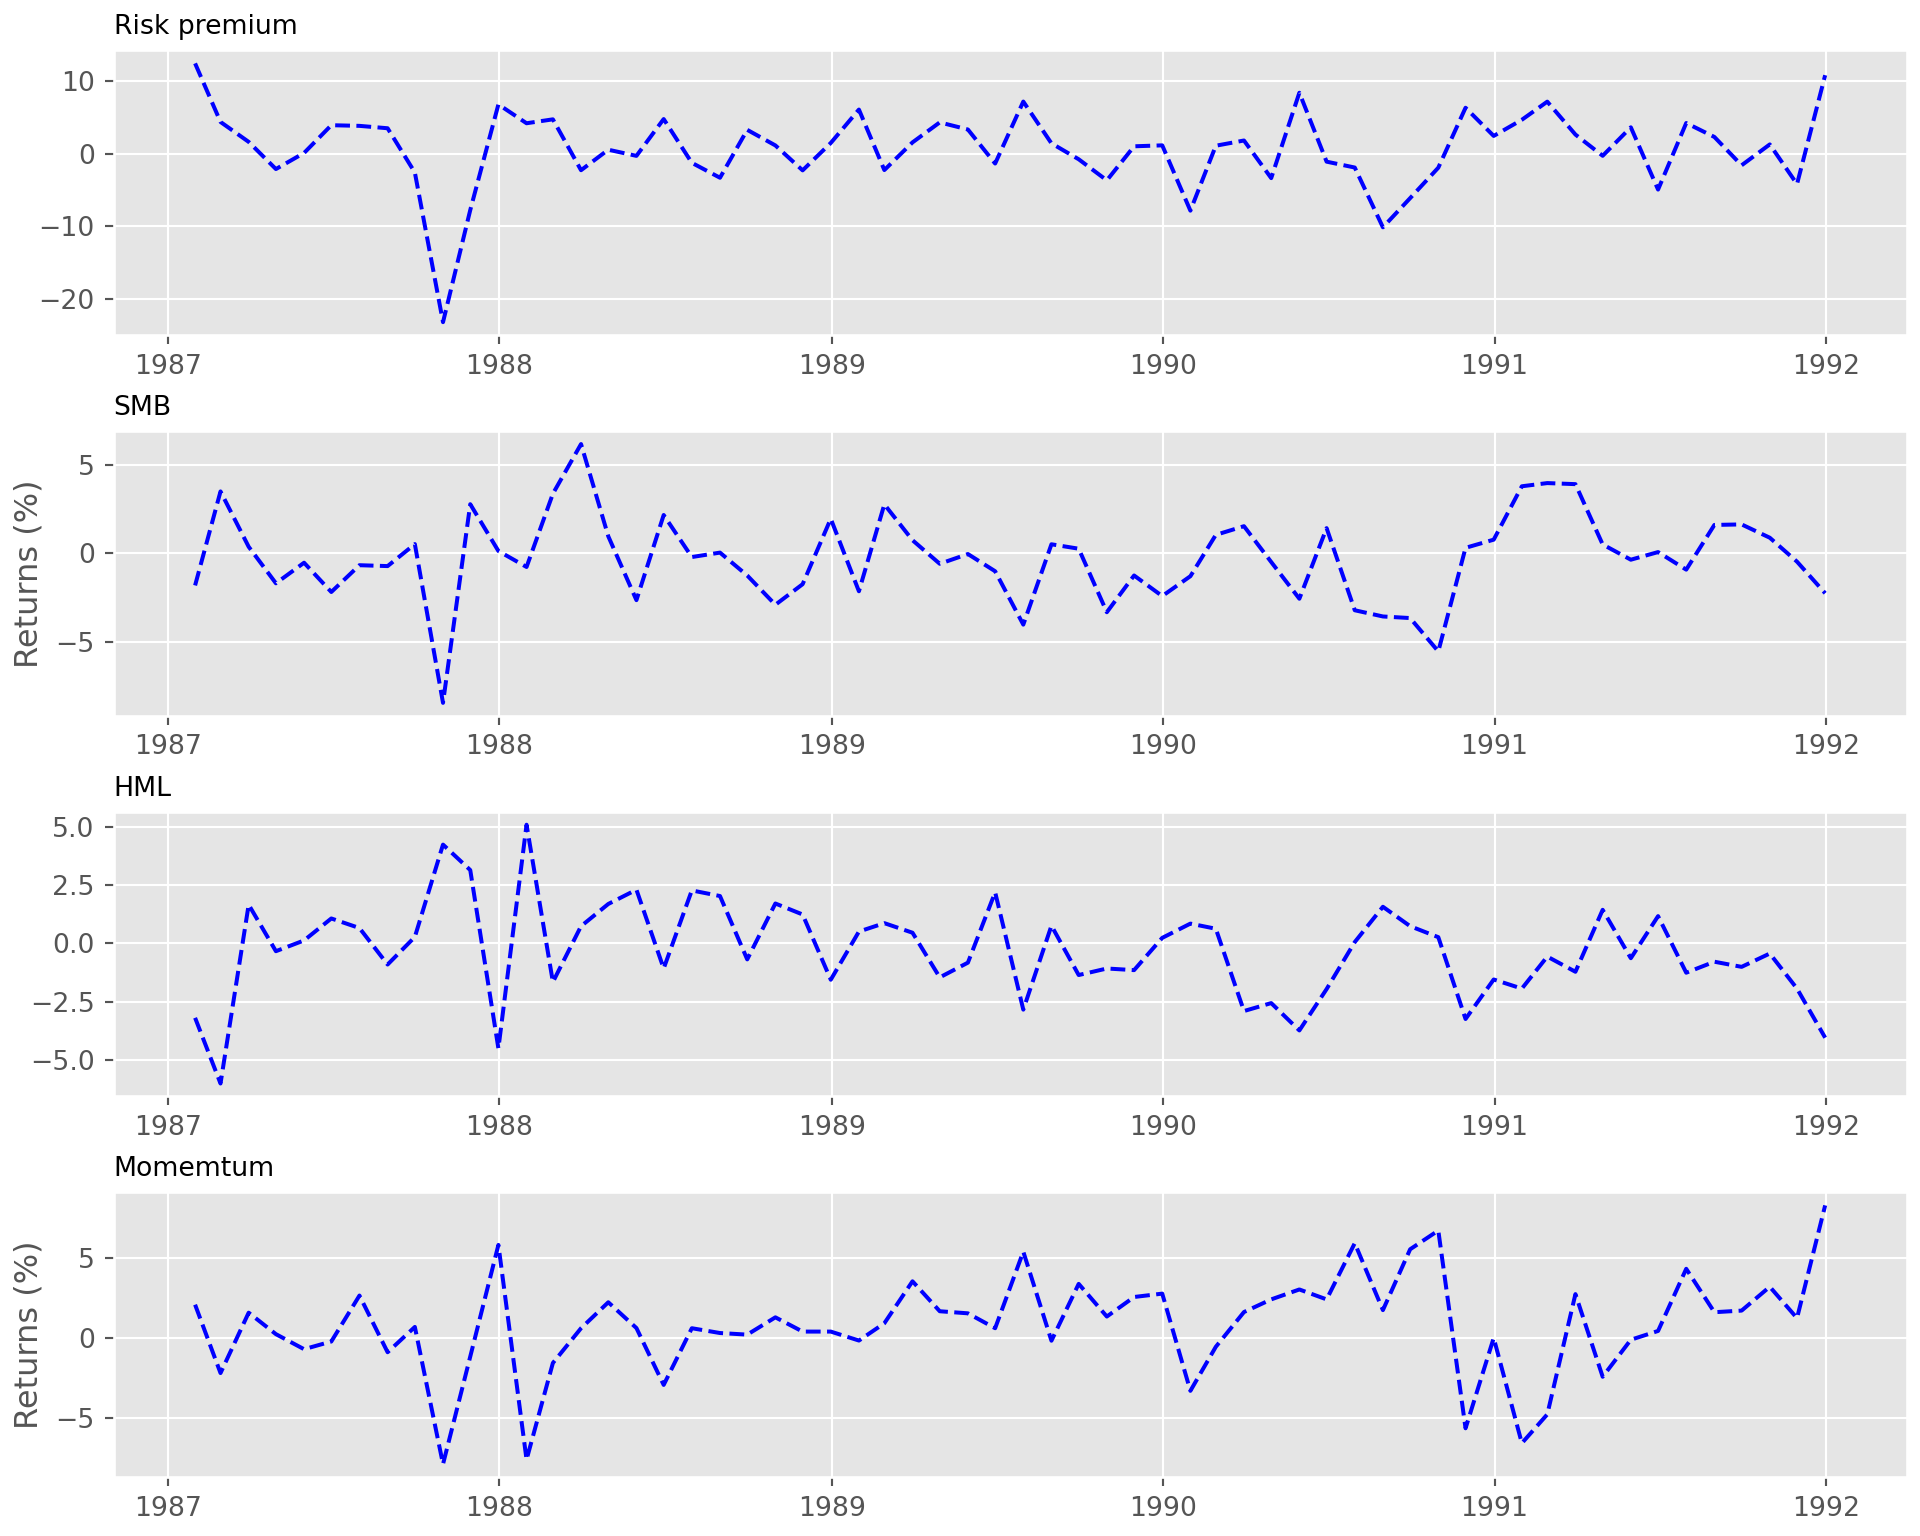
We’re returning to our portfolio discussion after detours into topics on the put-write index and non-linear correlations. We’ll be investigating alternative methods to analyze, quantify, and mitigate risk, including risk-constrained optimization, a topic that figures large in factor research. The main idea is that there are certain risks ...
[Read more...]

Plotting Surfaces with R

December 13, 2020 | R Views

In this post, I’d like to review some basic options for plotting three dimensional surfaces in R. In addition to producing some eye catching visualizations, plotting surfaces can also help develop one’s geometric intui...
[Read more...]
1 6 7 8 9 10 15

Never miss an update!
Subscribe to R-bloggers to receive
e-mails with the latest R posts.
(You will not see this message again.)

Click here to close (This popup will not appear again)