Advent of 2020, Day 15 – Databricks Spark UI, Event Logs, Driver logs and Metrics
Want to share your content on R-bloggers? click here if you have a blog, or here if you don't.
Series of Azure Databricks posts:
- Dec 01: What is Azure Databricks
- Dec 02: How to get started with Azure Databricks
- Dec 03: Getting to know the workspace and Azure Databricks platform
- Dec 04: Creating your first Azure Databricks cluster
- Dec 05: Understanding Azure Databricks cluster architecture, workers, drivers and jobs
- Dec 06: Importing and storing data to Azure Databricks
- Dec 07: Starting with Databricks notebooks and loading data to DBFS
- Dec 08: Using Databricks CLI and DBFS CLI for file upload
- Dec 09: Connect to Azure Blob storage using Notebooks in Azure Databricks
- Dec 10: Using Azure Databricks Notebooks with SQL for Data engineering tasks
- Dec 11: Using Azure Databricks Notebooks with R Language for data analytics
- Dec 12: Using Azure Databricks Notebooks with Python Language for data analytics
- Dec 13: Using Python Databricks Koalas with Azure Databricks
- Dec 14: From configuration to execution of Databricks jobs
Yesterday we looked into how Databricks jobs can be configured, how to use widgets to pass the parameters and typical general setting.
When debugging the jobs (or in this matter clusters), you will come across this part of the menu (it can be accessed from Jobs or from clusters) with Event Log, Spark UI, Driver Logs, Metrics. This is a view from Clusters

And same information can be accessed from Jobs (it is just positioned in the overview of the job):
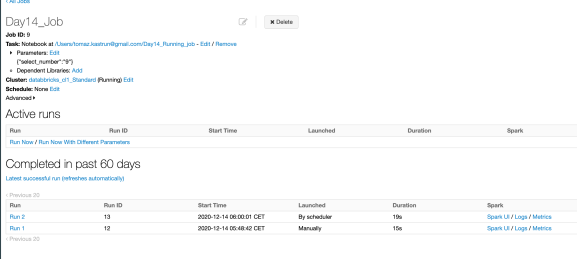
Both will get you to the same page.
1.Spark UI
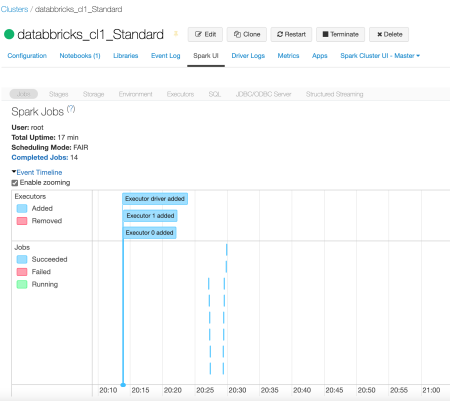
After running a job, or executing commands in notebooks, check the Spark UI on the cluster you have executed all the commands. The graphical User Interface will give you overview of execution of particular jobs/Executors and the timeline:
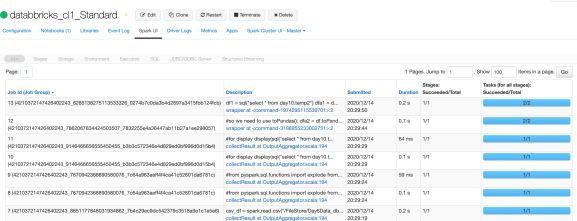
But if you need detailed description, where will be for each particular job ID (Job ID 13), you can see the execution time, Duration, Status and Job ID global unique identifier.
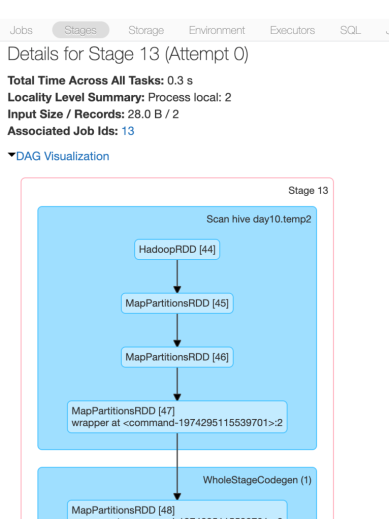
When clicking on Description of this Job ID, you will get more detailed overview. Besides the Event Timeline (what you can see in the above printscreen), you can also get the DAG visualization for better understanding how Spark API works and which services is using.
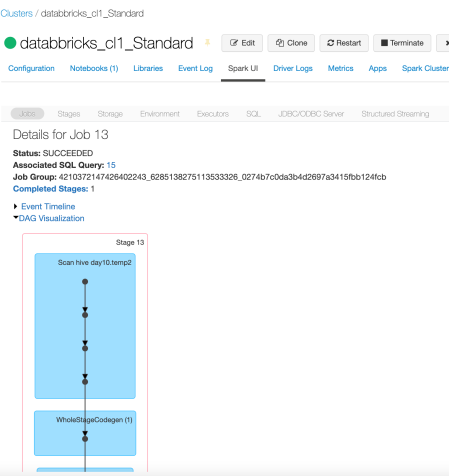
and under stages (completed, failed) you will find detailed execution description of each step.
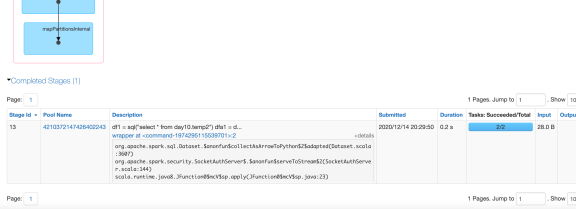
And for each of the steps under the description you can get even more detailed information of the stage.. Here is an example, of the detailed stage and the aggregated metrics:
and the aggregated metrics
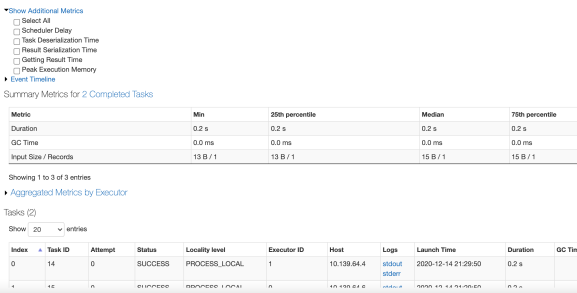
There is a lot of logs, when you want to investigate and troubleshoot the particular step.
Databricks provide three type of cluster activity logs:
- event logs – these logs capture the lifecycles of clusters: creation of cluster, start of cluster, termination and others
- driver logs – Spark driver and worker logs are great for debugging;
- init-script logs – for debugging init scripts.
2.Event Logs
Event logs capture and holds cluster information and action against the cluster.
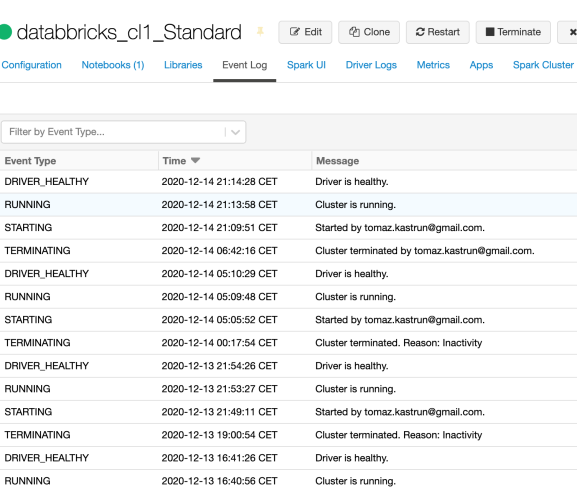
And you can see for each event type, there is a timestamp and message with detailed information. You can click on each of the event to get additional information. But this is what Event Logs will offer you. A good informative overview to what is happening with your clusters and their states.
3. Driver logs
Driver logs are divided into three sections:
- standard output
- standard error
- Log4j logs
and are a direct output (or prints) and log statements from the notebooks, jobs or libraries that go through Spark driver.
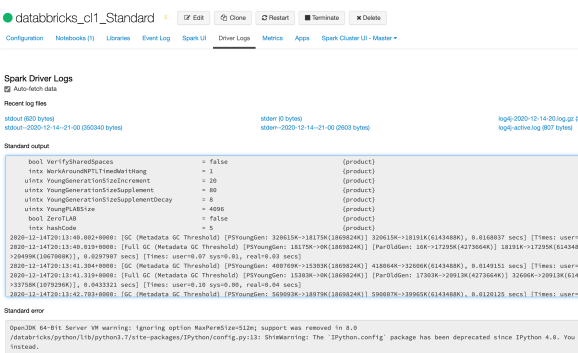
These logs will help you understand the execution of each cell on your notebook, or execution of a job and many more. The logs can easily be copy/pasted and, but the driver logs are stored periodically that newer content is usually at the bottom.
4. Metrics
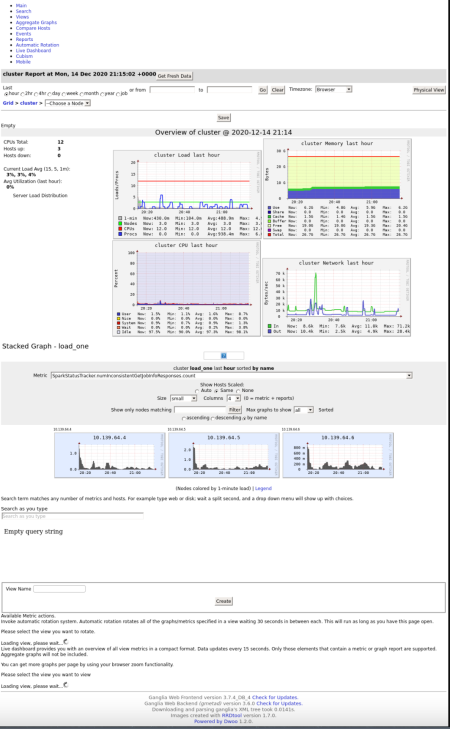
Metrics in Azure Databricks are mostly used for performance monitoring. These metrics are called Ganglia UI as metrics for lightweight troubleshooting.
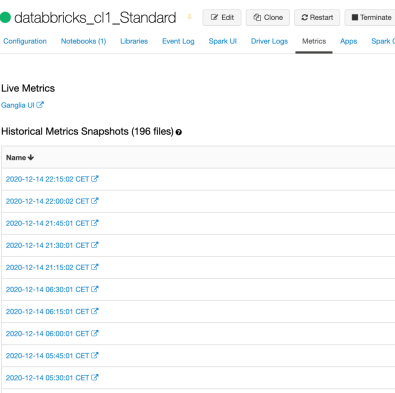
Each metrics represents historical snapshot and by clicking on one of them will get you a PNG report and can be zooom-in or zoom-out.
Tomorrow we will explore the models, and management of the model and will make one in R and in Python..
Complete set of code and Notebooks will be available at the Github repository.
Happy Coding and Stay Healthy!
R-bloggers.com offers daily e-mail updates about R news and tutorials about learning R and many other topics. Click here if you're looking to post or find an R/data-science job.
Want to share your content on R-bloggers? click here if you have a blog, or here if you don't.
