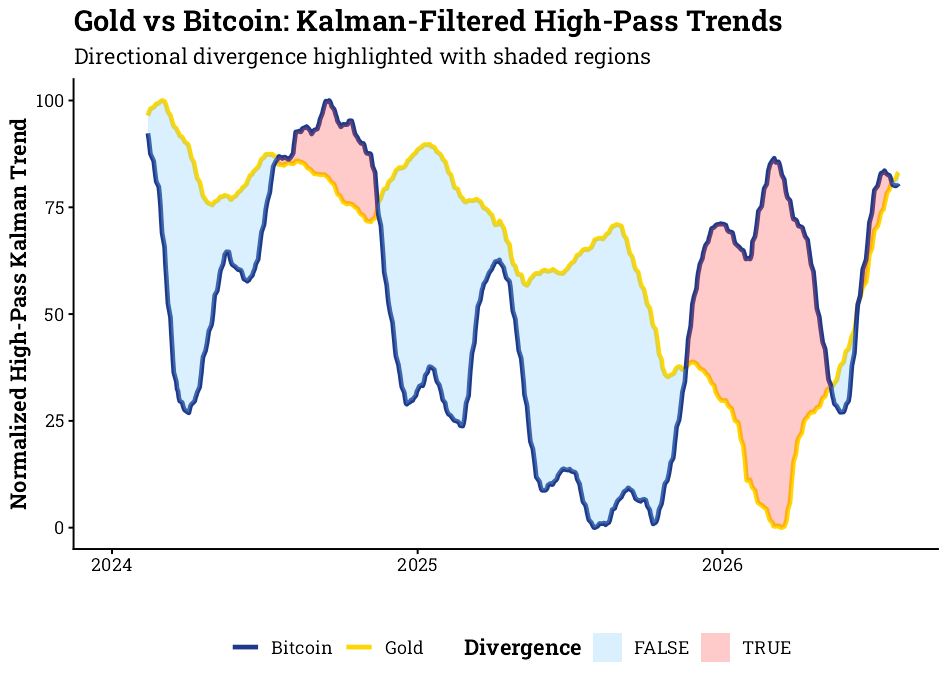
Dual scaled y-axis with ggplot()
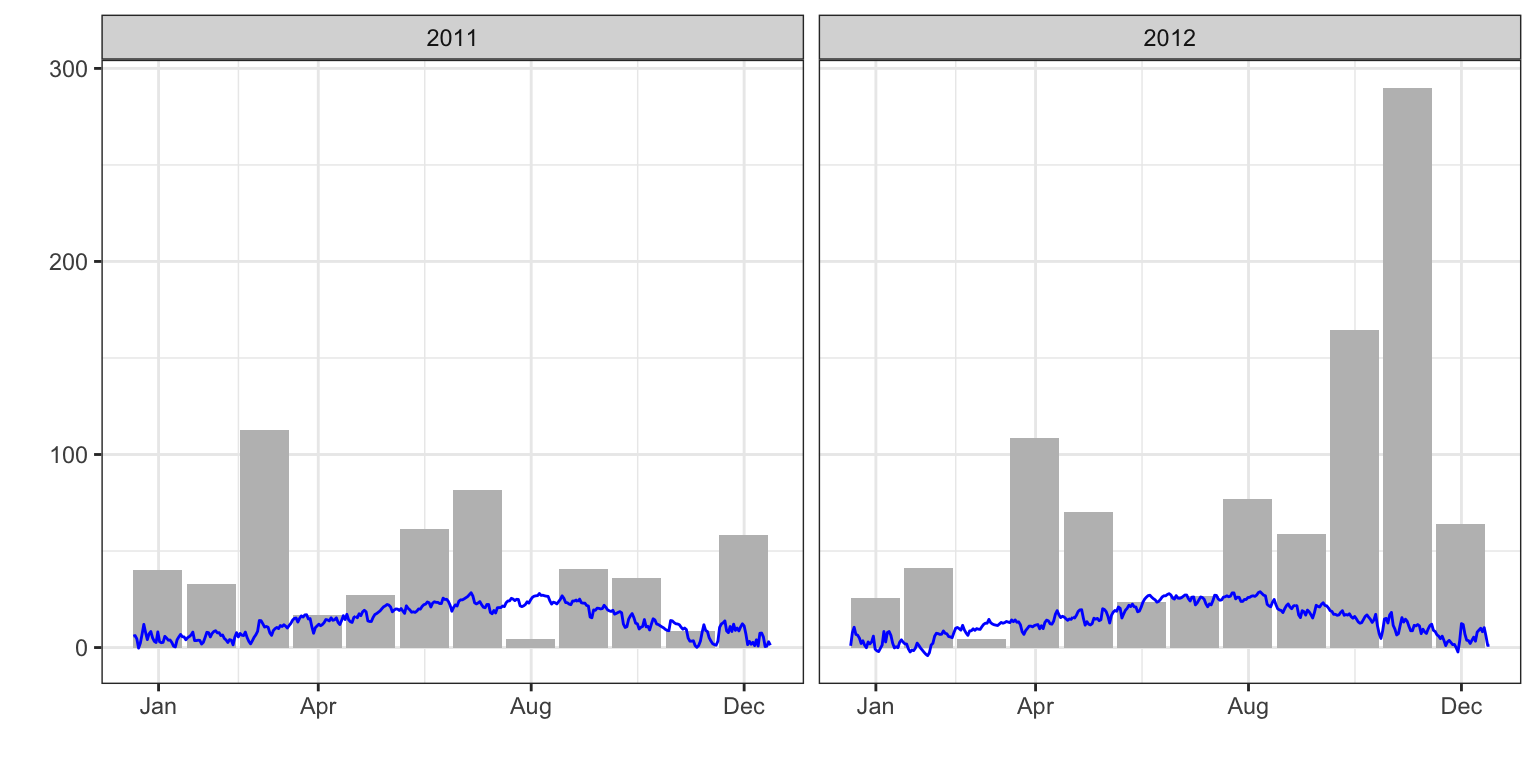
I have often found myself needing to plot a single graph with two y-axes having different scales. For example, this might be useful for representing temperature and rainfall data at a given location. Unfortunately, doing this with ggplot() is no...