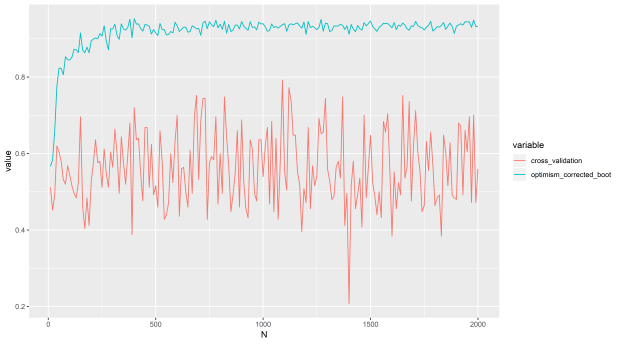
Articles by chris2016

Consensus clustering in R

February 4, 2020 | chris2016

The logic behind the Monti consensus clustering algorithm is that in the face of resampling the ideal clusters should be stable, thus any pair of samples should either always or never cluster together. We can use this principle to infer the optimal number of clusters (K). This works by examining ...
[Read more...]

How to make a precision recall curve in R

December 5, 2019 | chris2016

Precision recall (PR) curves are useful for machine learning model evaluation when there is an extreme imbalance in the data and the analyst is interested particuarly in one class. A good example is credit card fraud, where the instances of fraud are extremely few compared with non fraud. Here are ...
[Read more...]

How to easily make a ROC curve in R

November 26, 2019 | chris2016

A typical task in evaluating the results of machine learning models is making a ROC curve, this plot can inform the analyst how well a model can discriminate one class from a second. We developed MLeval (https://cran.r-project.org/web/packages/MLeval/index.html), a evaluation package for R, ...
[Read more...]

Running UMAP for data visualisation in R

June 8, 2019 | chris2016

UMAP is a non linear dimensionality reduction algorithm in the same family as t-SNE. In the first phase of UMAP a weighted k nearest neighbour graph is computed, in the second a low dimensionality layout of this is then calculated. Then the embedded data points can be visualised in a ...
[Read more...]

Quick and easy t-SNE analysis in R

May 30, 2019 | chris2016

t-SNE is a useful dimensionality reduction method that allows you to visualise data embedded in a lower number of dimensions, e.g. 2, in order to see patterns and trends in the data. It can deal with more complex patterns of Gaussian clusters in multidimensional space compared to PCA. Although is ...
[Read more...]

Easy quick PCA analysis in R

May 22, 2019 | chris2016

Principal component analysis (PCA) is very useful for doing some basic quality control (e.g. looking for batch effects) and assessment of how the data is distributed (e.g. finding outliers). A straightforward way is to make your own wrapper function for prcomp and ggplot2, another way is to use ...
[Read more...]

Using clusterlab to benchmark clustering algorithms

January 15, 2019 | chris2016

Clusterlab is a CRAN package (https://cran.r-project.org/web/packages/clusterlab/index.html) for the routine testing of clustering algorithms. It can simulate positive (data-sets with __1 clusters) and negative controls (data-sets with 1 cluster). Why test clustering algorithms? Because they often fail in identifying the true K in practice, published ...
[Read more...]

Simulating NXN dimensional Gaussian clusters in R

August 25, 2018 | chris2016

Gaussian clusters are found in a range of fields and simulating them is important as often we will want to test a given class discovery tools performance under conditions where the ground truth is known (e.g. K=6). However, a flexible Gaussian cluster simulator for simulating Gaussian clusters with defined ...
[Read more...]

Bias in high dimensional optimism corrected bootstrap procedure

June 28, 2018 | chris2016

I have been working in high dimensional analysis to predict drug response in rheumatoid arthritis patients and I was concerned to find the procedure called optimism corrected bootstrapping over-fits as p (number of features) increases. Optimism corrected bootstrapping is a way of trying to estimate the overfitting error of a ... [Read more...]

Never miss an update!
Subscribe to R-bloggers to receive
e-mails with the latest R posts.
(You will not see this message again.)

Click here to close (This popup will not appear again)