
Part 2: Optimism corrected bootstrapping is definitely bias, further evidence
Want to share your content on R-bloggers? click here if you have a blog, or here if you don't.
Some people are very fond of the technique known as ‘optimism corrected bootstrapping’, however, this method is bias and this becomes apparent as we increase the number of noise features to high numbers (as shown very clearly in my previous blog post). This needs exposing, I don’t have the time to do a publication on this nor the interest so hence this article. Now, I have reproduced the bias with my own code.
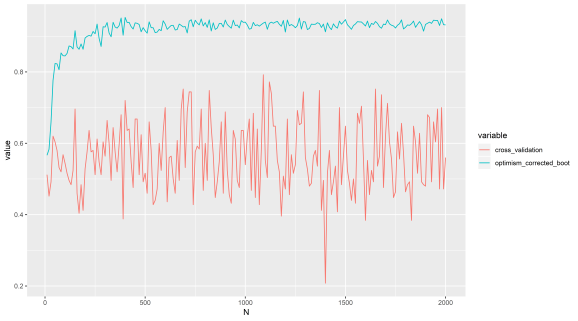
Let’s first just show the plot from last time again to recap, so as features increase (that are just noise), this method gives a strong positive AUC compared with cross validation. The response variable is random, the explanatory variables are random, so we should not get a positive result. Now, we are going to implement the method from scratch, instead of using Caret, and show the same thing.
Perhaps in lower dimensions the method is not so bad, but I suggest avoiding it in all cases. I consider it something of a hack to get statistical power. Regardless of where it is published and by whom. Why? Because I have tested it myself, I am sure we could find some simulations that support its use somewhere, but LOOCV and K-fold cross validation do not have this problem. This method is infecting peoples work with a positive results bias in high dimensions, possibly lower dimensions as well.
After reading the last post Frank Harrell indirectly accused the makers of the Caret software as being somehow incorrect in their code implementation, so my results he decided were ‘erroneous’. I doubted this was the case, so now we have more evidence to expose the truth. This simple statistical method is described in this text book and a blog post (below), for those who are interested:
Steyerberg, Ewout W. Clinical prediction models: a practical approach to development, validation, and updating. Springer Science & Business Media, 2008.
The steps of this method, briefly, are as follows:
- Fit a model M to entire data S and estimate predictive ability C.
- Iterate from b=1…B:
- Take a resample from the original data, let this be S*
- Fit the bootstrap model M* to S* and get predictive ability, C_boot
- Use the bootstrap model M* to get predictive ability on S, C_orig
- Optimism O is calculated as mean(C_boot – C_orig)
- Calculate optimism corrected performance as C-O.
This is a general procedure (Steyerberg, 2008) and so I can use glmnet to fit the model and AUC as my measure of predictive performance. Glmnet is basically logistic regression with feature selection, so if this method for estimating ‘optimism’ is a good one, we should be able to estimate the optimism of overfitting this model using the above method, then correct for it.
Let’s re-run the analysis with my implementation of this method and compare with Caret (which is great software). Caret agrees with my implementation as shown below in fully reproducible code.
This code should be fine to copy and paste into R. The data is random noise, yet, optimism corrected bootstrapping gives a strong positive result AUC of 0.86, way way above what we would expect of 0.5.
In contrast, below I give code for Caret cross validation which gives the correct result, just test it for yourself instead of believing statistical dogma.
> corrected
[1] 0.858264


##
library(glmnet)
library(pROC)
library(caret)

## set up test data
test <- matrix(rnorm(100*1000, mean = 0, sd = 1),
nrow = 100, ncol = 1000, byrow = TRUE)
labelsa <- as.factor(c(rep('A',50),rep('B',50)))
colnames(test) <- paste('Y',seq(1,1000),sep='')
row.names(test) <- paste('Z',seq(1,100),sep='')

### my own implementation of optimism corrected bootstrapping

## 1. fit model to entire test data (i.e. overfit it)

orig <- glmnet(test,y=labelsa,alpha=1,family = "binomial")
preds <- predict(orig,newx=test,type='response',s=0.01)
auc <- roc(labelsa,as.vector(preds))
original_auc <- as.numeric(auc$auc)

## 2. take resample of data and try to estimate optimism

test2 <- cbind(test,labelsa)
B <- 50
results <- matrix(ncol=2,nrow=B)
for (b in seq(1,B)){
## get the bootstrapped resampled data
boot <- test2[sample(row.names(test2),50),]
labelsb <- boot[,ncol(boot)]
boot <- boot[,-ncol(boot)]
## use the bootstrapped model to predict its own labels
bootf <- glmnet(boot,y=labelsb,alpha=1,family = "binomial")
preds <- predict(bootf,newx=boot,type='response',s=0.01)
auc <- roc(labelsb,as.vector(preds))
boot_auc <- as.numeric(auc$auc)
## use bootstrap model to predict original labels
preds <- predict(bootf,newx=test,type='response',s=0.01)
auc <- roc(labelsa,as.vector(preds))
boot_original_auc <- as.numeric(auc$auc)
## add the data to results
results[b,1] <- boot_auc
results[b,2] <- boot_original_auc
}
## calculate the optimism
O <- mean(results[,1]-results[,2])
## calculate optimism corrected measure of prediction (AUC)
corrected <- original_auc-O

### caret implementation of optimism corrected bootstrapping

test3 <- data.frame(test2)
test3$labelsa <- as.factor(test3$labelsa)
test3$labelsa <- make.names(test3$labelsa)

ctrl <- trainControl(method = 'optimism_boot',
summaryFunction=twoClassSummary,
classProbs=T,
savePredictions = T,
verboseIter = T)
fit1 <- train(as.formula( paste( 'labelsa', '~', '.' ) ), data=test3,
method="glmnet", # preProc=c("center", "scale")
trControl=ctrl, metric = "ROC")

### sanity check, using cv

ctrl <- trainControl(method = 'cv',
summaryFunction=twoClassSummary,
classProbs=T,
savePredictions = T,
verboseIter = T)
fit2 <- train(as.formula( paste( 'labelsa', '~', '.' ) ), data=test3,
method="glmnet", # preProc=c("center", "scale")
trControl=ctrl, metric = "ROC")
Here is a plot repeating the Caret results I did with a simple loop to iteratively add noise only features and getting the corrected AUC for each iteration, but this is with my own implementation instead of Caret. You can try this out by sticking a FOR loop outside the code above to calculate the 'corrected' AUC. You can see the same misleading trend as we saw in the last post.
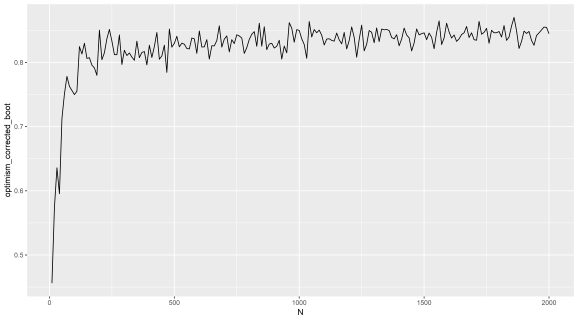
(X axis = number of noise only features added to random labels)
(Y axis = ‘optimism corrected bootstrap AUC’)
People are currently using this method because it is published and they some how think published methods do not have fundamental problems, which is a widespread misconception.
R machine learning practitioners, do not trust methods just because some statistican says they are good in some paper or a forum, do not pick pet methods you love and so can never see the flaws in, test different methods and run your own positive and negative controls. Try and be objective.
R-bloggers.com offers daily e-mail updates about R news and tutorials about learning R and many other topics. Click here if you're looking to post or find an R/data-science job.
Want to share your content on R-bloggers? click here if you have a blog, or here if you don't.