Structural equation model trees with partykit and lavaan
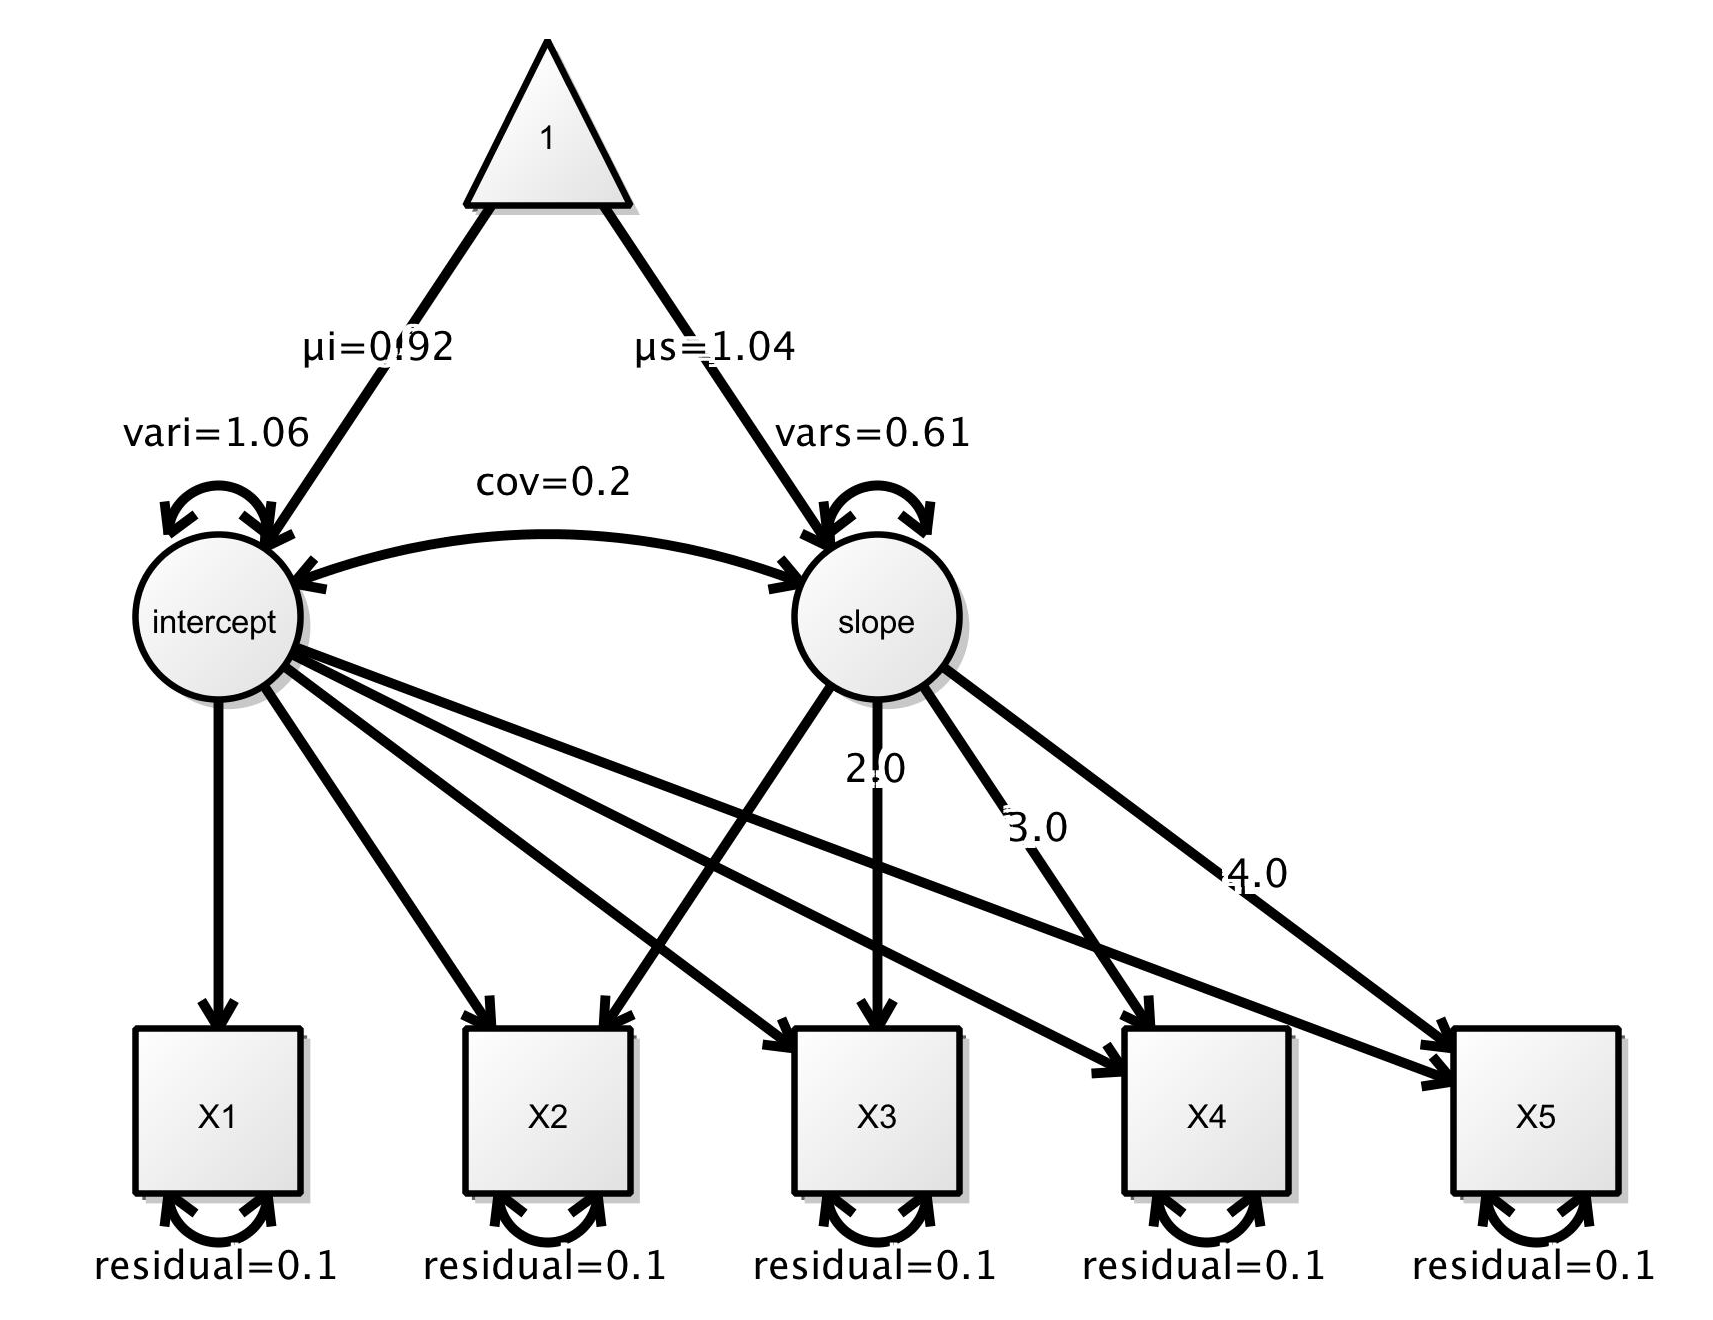
To capture heterogeneity in structural equation models (SEMs), the model-based recursive partitioning (MOB) algorithm from partykit can be coupled with SEM estimation from lavaan.
Motivation
Structural equation models (SEMs) ar... [Read more...]