February 2020

Benchmarking the portfolio

February 13, 2020 | R on OSM

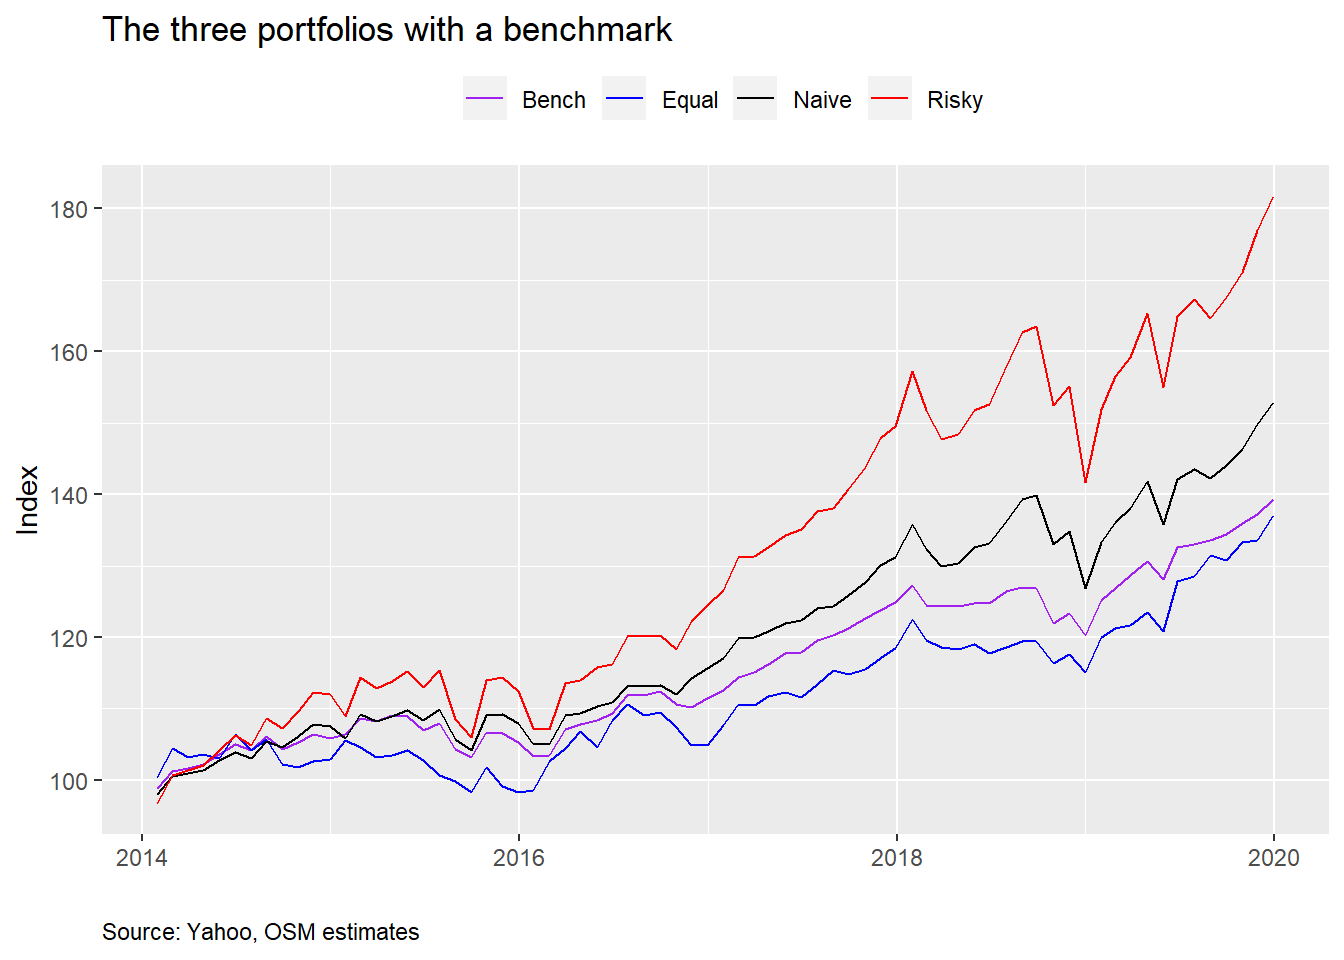
In our last post, we looked at one measure of risk-adjusted returns, the Sharpe ratio, to help our hero decide whether he wanted to alter his portfolio allocations. Then, as opposed to finding the maximum return for our hero’s initial level of risk,...
[Read more...]

Benchmarking the portfolio

February 13, 2020 | R on OSM

In our last post, we looked at one measure of risk-adjusted returns, the Sharpe ratio, to help our hero decide whether he wanted to alter his portfolio allocations. Then, as opposed to finding the maximum return for our hero’s initial level of risk, we broadened the risk parameters and ...
[Read more...]

Animated Plots using ggplot and gganimate

February 13, 2020 | Lea Waniek

A short overview of the functionalities of the R package gganimate: Learn how to turn your static ggplots in beautiful animations showcasing your data. Der Beitrag Animated Plots using ggplot and gganimate erschien zuerst auf STATWORX. [Read more...]

Visualizing the Tallest Building in Each State

February 13, 2020 | Unknown

Via Digg:This data visualization, put together by takeasecond on Reddit, shows the tallest building in all 50 states in 2020. As the graph demonstrates, the current tallest building in America is New York's One World Trade Center at 1,776 feet tall. In...
[Read more...]

The complete guide to clustering analysis: k-means and hierarchical clustering by hand and in R

February 12, 2020 | R on Stats and R

What is clustering analysis? Application 1: Computing distances Solution k-means clustering Application 2: k-means clustering Data kmeans() with 2 groups Quality of a k-means partition nstart for several initial centers and better stability kmeans() with 3 groups Optimal number of clusters Elbow method Silhouette method Gap statistic method NbClust() Visualizations Manual application and verification ...
[Read more...]

The complete guide to clustering analysis: k-means and hierarchical clustering by hand and in R

February 12, 2020 | R on Stats and R

What is clustering analysis? Application 1: Computing distances Solution k-means clustering Application 2: k-means clustering Data kmeans() with 2 groups Quality of a k-means partition nstart for several initial centers kmeans() with 3 groups Manual application and verification in R Solution by hand Solution in R Hierarchical clustering Application 3: hierarchical clustering Data Solution by ...
[Read more...]

Photo Mosaics in R

February 12, 2020 | R Views

Harrison Schramm, CAP, PStat, is a Senior Fellow at the Center for Strategic and Budgetary Assessments. In this short piece, I’m going to discuss a fun photography project I did over the winter using R. I’m also going to touch on some of the implications of the R ...
[Read more...]

taxadb: A High-Performance Local Taxonomic Database Interface

February 12, 2020 | rOpenSci - open tools for open science

Dealing with taxonomic inconsistencies within and across datasets is a fundamental challenge of ecology and evolutionary biology. Accounting for species synonyms, taxa splitting and unification is especially important as aggregation of data across time and different data sources becomes increasingly common. One potentially powerful approach for addressing these issues is ... [Read more...]

Foreign Demand for France, Germany, Italy and Spain

February 12, 2020 | Thomas Brand

Our purpose is to build the quarterly foreign demand for France, Germany, Italy and Spain. To construct these series we use data from DBnomics, through the rdbnomics package. All the code is written in R, thanks to the RCoreTeam (2016) and RStudioTeam (2016). For each country, we proceed in three steps: we ...
[Read more...]
1 6 7 8 9 10 13

Never miss an update!
Subscribe to R-bloggers to receive
e-mails with the latest R posts.
(You will not see this message again.)

Click here to close (This popup will not appear again)