February 2019

Statswars

February 7, 2019 | R on kieranhealy.org

I am stuck at home sick today, so I decided to provide a relational analysis of the Stats Package Wars that have been bubbling away for the past week. True in all its details. If you want something slightly more constructive, consider The Plain Person’s Guide to Plain-Text Social ... [Read more...]

Are you leaking h2o? Call plumber!

February 7, 2019 | Longhow Lam

Create a predictive model with the h2o package. H2o is a fantastic open source machine learning platform with many different algorithms. There is Graphical user interface, a Python interface and an R interface. Suppose you want to create a predictive … Continue reading →
[Read more...]

Investigating words distribution with R – Zipf’s law

February 7, 2019 | Michal Maj

Hello again! Typically I would start by describing a complicated problem that can be solved using machine or deep learning methods, but today I want to do something different, I want to show you some interesting probabilistic phenomena! Have you heard of Zipf’s law? I hadn’t until recently. ...
[Read more...]

Le Monde puzzle [#1083]

February 6, 2019 | xi'an

A Le Monde mathematical puzzle that seems hard to solve without the backup of a computer (and just simple enough to code on a flight to Montpellier): Given the number N=2,019, find a decomposition of N as a sum of non-trivial powers of integers such that (a) the number of ...
[Read more...]

PDSwR2: New Chapters!

February 6, 2019 | Nina Zumel

We have two new chapters of Practical Data Science with R, Second Edition online and available for review! The newly available chapters cover: Data Engineering And Data Shaping – Explores how to use R to organize or wrangle data into a shape useful for analysis. The chapter covers applying data transforms, ...
[Read more...]

Mapping multiple trends with confidence

February 6, 2019 | Michael

A tutorial to compute trends by groups and plot/map the results We will use dplyr::nest to create a list-column and will apply a model (with purrr::map) to each row, then we will extract each slope and its p-value with map and broom::tidy. Setup Data Map data. ... [Read more...]

Visualizing New York City WiFi Access with K-Means Clustering

February 5, 2019 | Michael Grogan

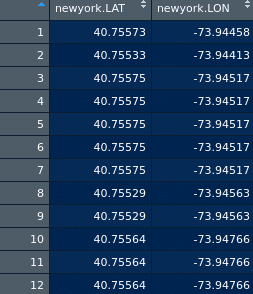
CategoriesAdvanced Modeling Tags K Means R Programming Unsupervised Learning Visualization has become a key application of data science in the telecommunications industry. Specifically, telecommunication analysis is highly dependent on the use of geospatial data. This is because telecommunication networks in themselves are geographically dispersed, and analysis of such dispersions can ...
[Read more...]

R for trial and model-based cost-effectiveness analysis

February 5, 2019 | R on Gianluca Baio

9 July 2019, University College London Training event (8 July): Torrington (1-19) B07 - Teal Room in Torrington Place, 1-19 (), University College London, United Kingdom Main workshop (9 July): Anatomy G29 J Z Young Lecture Theatre, UCL Medical Sciences and Anatomy (https://goo.gl/maps/biryoFc9CiL2), University College London, United Kingdom. Background and ... [Read more...]

R for Quantitative Health Sciences: An Interview with Jarrod Dalton

February 5, 2019 | R Views

This interview came about through researching R-based medical applications in preparation for the upcoming R/Medicine conference. When we discovered the impressive number of Shiny-based Risk Calculators developed by the Cleveland Clinic and implemented in public-facing sites, we wanted to learn more about the influence of R Language in the ... [Read more...]

Version 0.7.0 of NIMBLE released

February 5, 2019 | Chris Paciorek

We’ve released the newest version of NIMBLE on CRAN and on our website. NIMBLE is a system for building and sharing analysis methods for statistical models, especially for hierarchical models and computationally-intensive methods (such as MCMC and SMC). Version 0.7.0 provides a variety of new features, as well as various ...
[Read more...]

Learning Data Science: Modelling Basics

February 5, 2019 | Learning Machines

Data Science is all about building good models, so let us start by building a very simple model: we want to predict monthly income from age (in a later post we will see that age is indeed a good predictor for income). For illustrative purposes we just make up some ... [Read more...]

Slides

February 4, 2019 | Modeling with R

Create slides in Markdown with Academic Academic | Documentation Features Efficiently write slides in Markdown 3-in-1: Create, Present, and Publish your slides Supports speaker notes Mobile friendly slides Controls Next: Right Arrow or Space Previous: Left Arrow Start: Home Finish: End Overview: Esc Speaker notes: S Fullscreen: F Zoom: Alt + Click ... [Read more...]

Brandeis and Hugo discuss people of color and under-represented groups in data science.

February 4, 2019 | Hugo Bowne-Anderson

Hugo Bowne-Anderson, the host of DataFramed, the DataCamp podcast, recently interviewed Brandeis Marshall, Associate Professor of Computer Science in the Computer and Information Sciences Department at Spelman College. Here is the podcast link. Introducing Brandeis Marshall Hugo: Hi there, Brandeis, and welcome to DataFramed. Brandeis: Well, thank you. Wonderful to ...
[Read more...]
1 9 10 11 12 13

Never miss an update!
Subscribe to R-bloggers to receive
e-mails with the latest R posts.
(You will not see this message again.)

Click here to close (This popup will not appear again)