February 2018

How to make a shaded relief in R

February 3, 2018 | Code R

While trying to build a circular colour scale to plot angles and wind direction, I stumbled upon an easy way to make shaded reliefs in R. You known, when you look at cool maps of mountain areas where peaks and valleys are easily distinguishable from their shadows like this: What ...
[Read more...]

goodreads: what books #estoniareads?

February 3, 2018 | reigo.eu

Estonian National Broadcasting Agency run a wonderful campaign called “Eesti loeb” (Estonia reads), where people were asked to post a picture of themselves with a book they are reading (or have read) and find inspiring. Photos of readers with their favourite books were published afterwards. But which books are the ... [Read more...]

Documenting R packages: roxygen2 vs. direct Rd input

February 3, 2018 | Iñaki Úcar

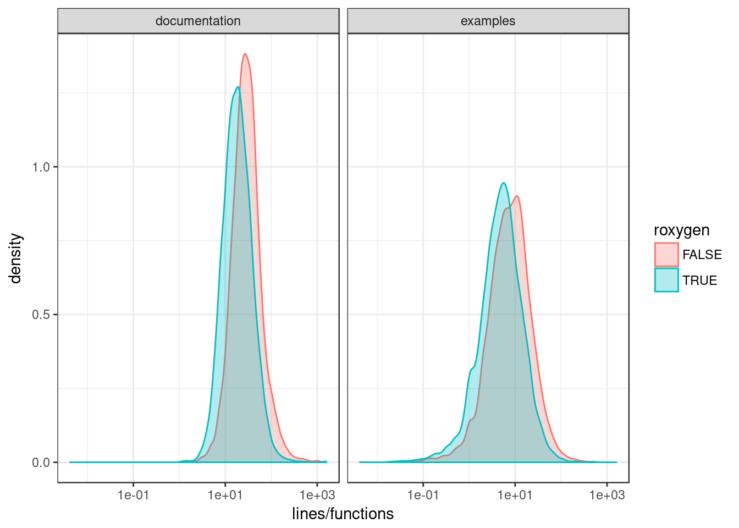
As the reader may know, R objects are documented in files written in “R documentation” (Rd) format, a simple markup language much of which closely resembles (La)TeX, which can be processed into a variety of formats, including LaTeX, HTML and plain text. This LaTeX-like syntax, combined with the fact ...
[Read more...]

Enter SadMan

February 2, 2018 | HighlandR

Yet more Metalliplots I’m just going to tidy up some issues from my last post where I did some tidytext analysis on the legendary rockers - Metallica. It was a fun way to pass some time and keep my hand in with text mining, something I st...
[Read more...]

RVowpalWabbit 0.0.12

February 2, 2018 | Thinking inside the box

And yet another boring little RVowpalWabbit package update, now to version 0.0.12, and still in response to the CRAN request of not writing files where we should not (as caught by new tests added by Kurt). I had misinterpreted one flag and actually i... [Read more...]

Analyse Bioscreen growth curves using BAT 2.0

February 2, 2018 | Måns

Some years ago, I developed an R script for analysing growth curves from Bioscreen C MBR machines. The script, called BAT (an acronym for Bioscreen Analysis Tool), has been used to analyse Bioscreen data in several labs across the globe – for instance in the work leading up to our paper ... [Read more...]

Write Elegant Loops Using Loop Invariants

February 1, 2018 | manio

Writing loops is an essential part of programming, but writing elegant loops is not easy. For example, in an interview Linus showed a commonly used piece of code which delete an entry in a link list (we will discuss this example). The task was simple but the loop in the ... [Read more...]

Free ticket to eRum

February 1, 2018 | R on The Jumping Rivers Blog

The Main Competition The Secondary Competition So… big news. Jumping Rivers is sponsoring eRum 2018 and in light of this news we are giving away a free place at the conference! (Not to mention our very own lead consultant, Colin Gillespie, i...
[Read more...]

Cost-Effective BigQuery with R

February 1, 2018 | R Views

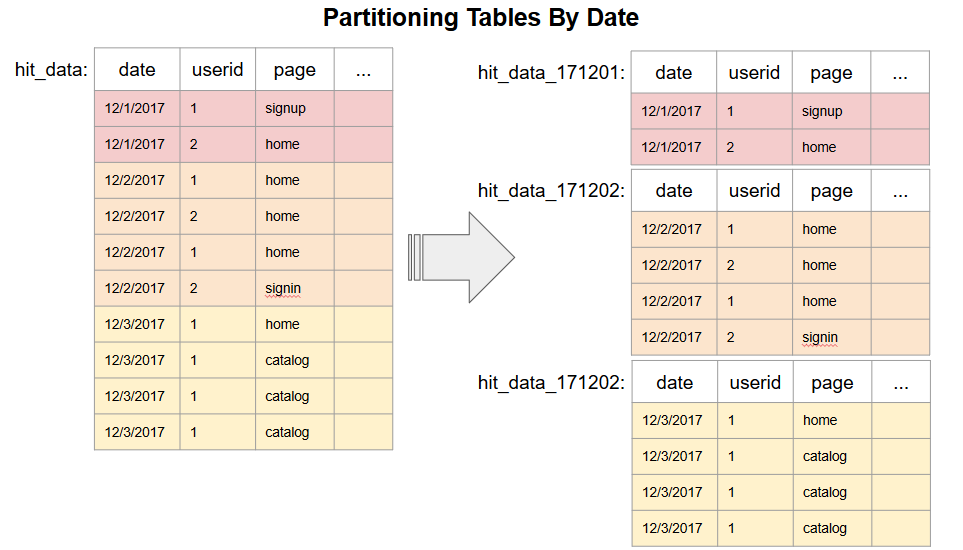
Introduction Companies using Google BigQuery for production analytics often run into the following problem: the company has a large user hit table that spans many years. Since queries are billed based on the fields accessed, and not on the date-ranges queried, queries on the table are billed for all available ...
[Read more...]

In between a rock and a conditional join

February 1, 2018 | Mango Solutions

Adnan Fiaz Joining two datasets is a common action we perform in our analyses. Almost all languages have a solution for this task: R has the built-in merge function or the family of join functions in the dplyr package, SQL has the JOIN operation and Python has the merge function ...
[Read more...]

Free ticket to eRum

February 1, 2018 | R on The Jumping Rivers Blog

The Main Competition The Secondary Competition So… big news. Jumping Rivers is sponsoring eRum 2018 and in light of this news we are giving away a free place at the conference! (Not to mention our very own lead consultant, Colin Gillespie, i... [Read more...]

Why No Exact Permutation Tests at Scale?

February 1, 2018 | John Mount

Here at Win-Vector LLC we like permutation tests. Our team has written on them (for example: How Do You Know if Your Data Has Signal?) and they are used to estimate significances in our sigr and WVPlots R packages. For example permutation methods are used to estimate the significance reported ...
[Read more...]
1 10 11 12

Never miss an update!
Subscribe to R-bloggers to receive
e-mails with the latest R posts.
(You will not see this message again.)

Click here to close (This popup will not appear again)