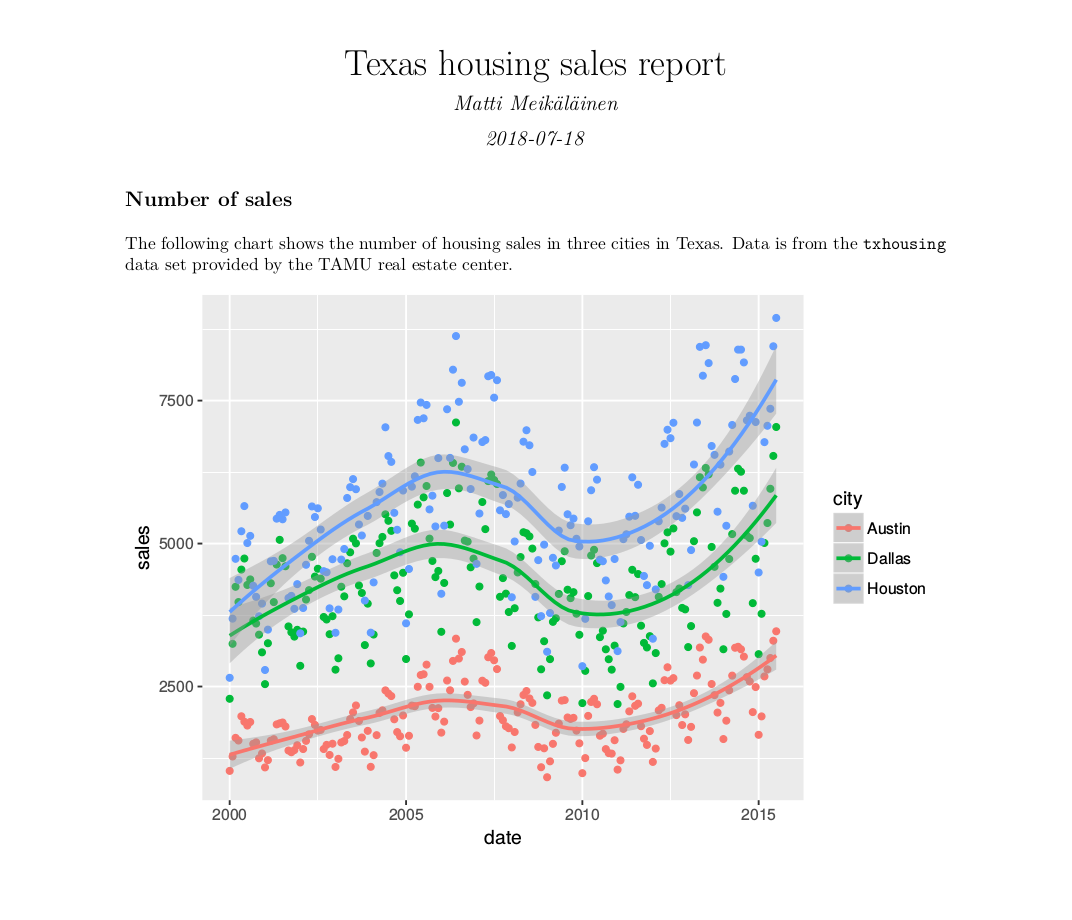
Creating legends when aesthetics are constants in ggplot2
In general, if you want to map an aesthetic to a variable and get a legend in ggplot2 you do it inside aes(). If you want to set an aesthetic to a constant value, like making all your points purple, you do it outside aes().
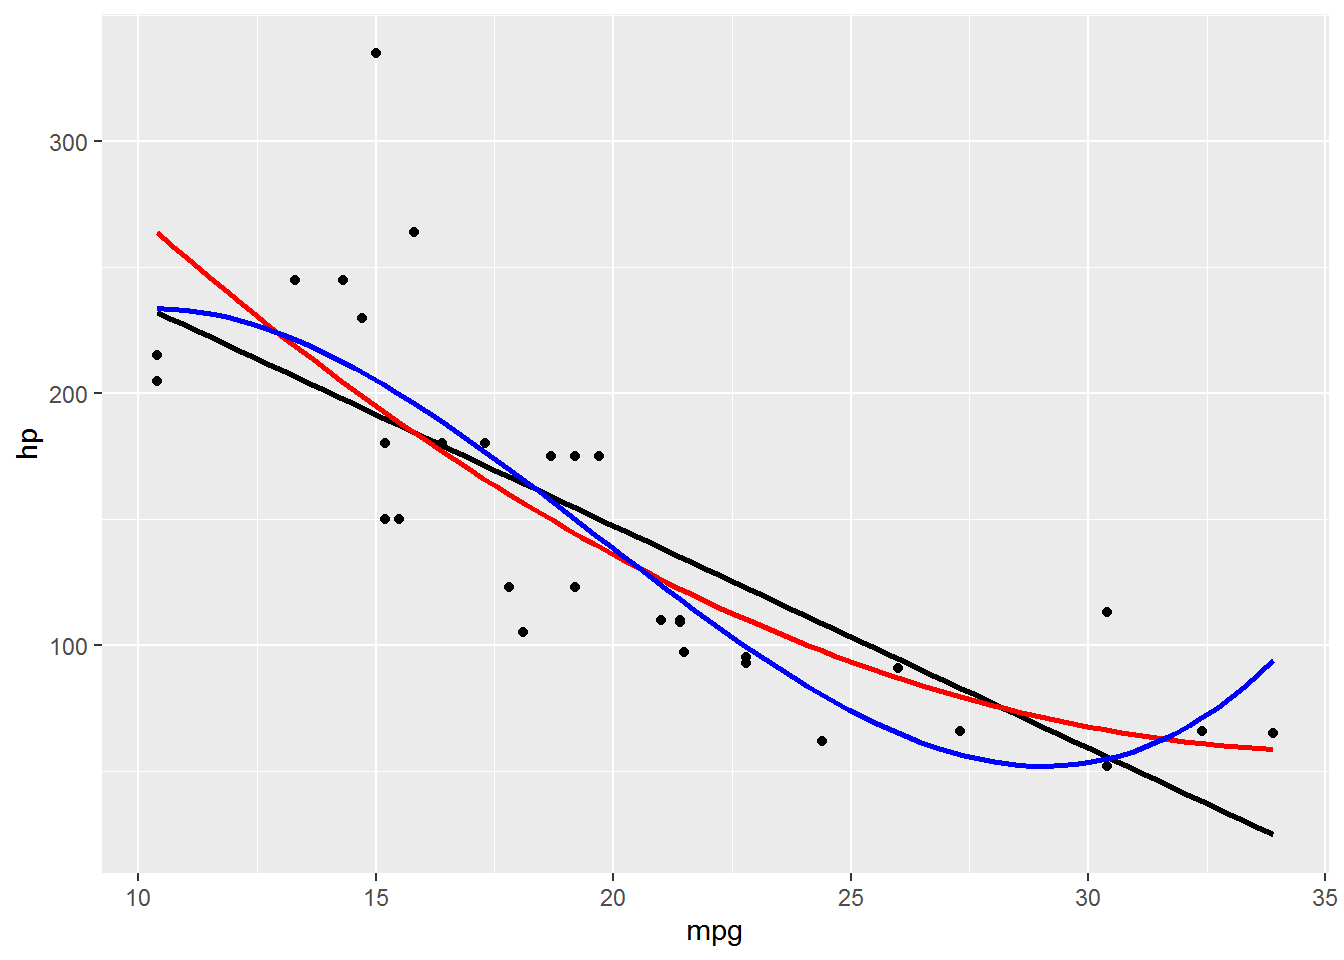
However, there are situations where ...