April 2018

Mathematical art in R

April 3, 2018 | David Smith

Who says there's no art in mathematics? I've long admired the generative art that Thomas Lin Peterson occasionally posts (and that you can see on Instagram), and though he's a prolific R user I'm not quite sure how he makes his art. Marcus Volz has another beautiful portfolio of generative ... [Read more...]

My Data Science Tool Box

April 3, 2018 | Ista Zahn

This post describes the tools I currently use for working with data. People often ask me to recommend specific tools, and I always hesitate, because so much boils down to personal preference. I recently added a workshop to the DSS lineup providing an ... [Read more...]

An overview of keyword extraction techniques

April 3, 2018 | Super User

In this blogpost, we will show 6 keyword extraction techniques which allow to find keywords in plain text. Keywords are frequently occuring words which occur somehow together in plain text. Common examples are New York, Monte Carlo, Mixed Models, Brussels Hoofdstedelijk Gewest, Public Transport, Central Station, p-values, ... If you master these ... [Read more...]

Why you should master the small multiple chart

April 3, 2018 | Sharp Sight

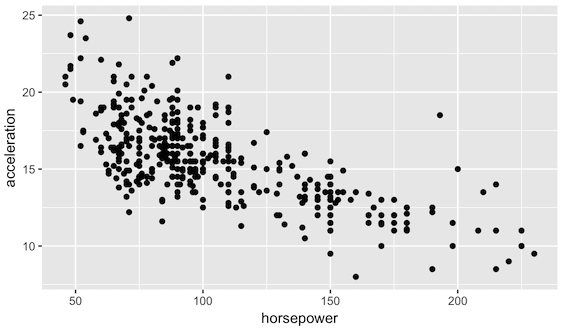
I’ve often said that the foundation of data science is data analysis. That’s not to say that data analysis and data science are 100% synonymous (they’re not), but rather that you need to master the basic tools of data analysis before you can get into the more advanced ...
[Read more...]

Why you should master the small multiple chart

April 3, 2018 | Sharp Sight

I’ve often said that the foundation of data science is data analysis. That’s not to say that data analysis and data science are 100% synonymous (they’re not), but rather that you need to master the basic tools of data analysis before you can get into the more advanced ... [Read more...]

Data on energy consumption and CO2 emissions

April 3, 2018 | Economics and R - R posts

I like to start my courses in energy economics and environmental economics by asking some question like Which energy source, e.g. gas, coal, nuclear, oil, renewables had the largest absolute increase in world wide energy consumption between the years 2000 und 2016? And then show some data. Below you can see ... [Read more...]

Ridgelines in bayesplot 1.5.0

April 2, 2018 | Higher Order Functions

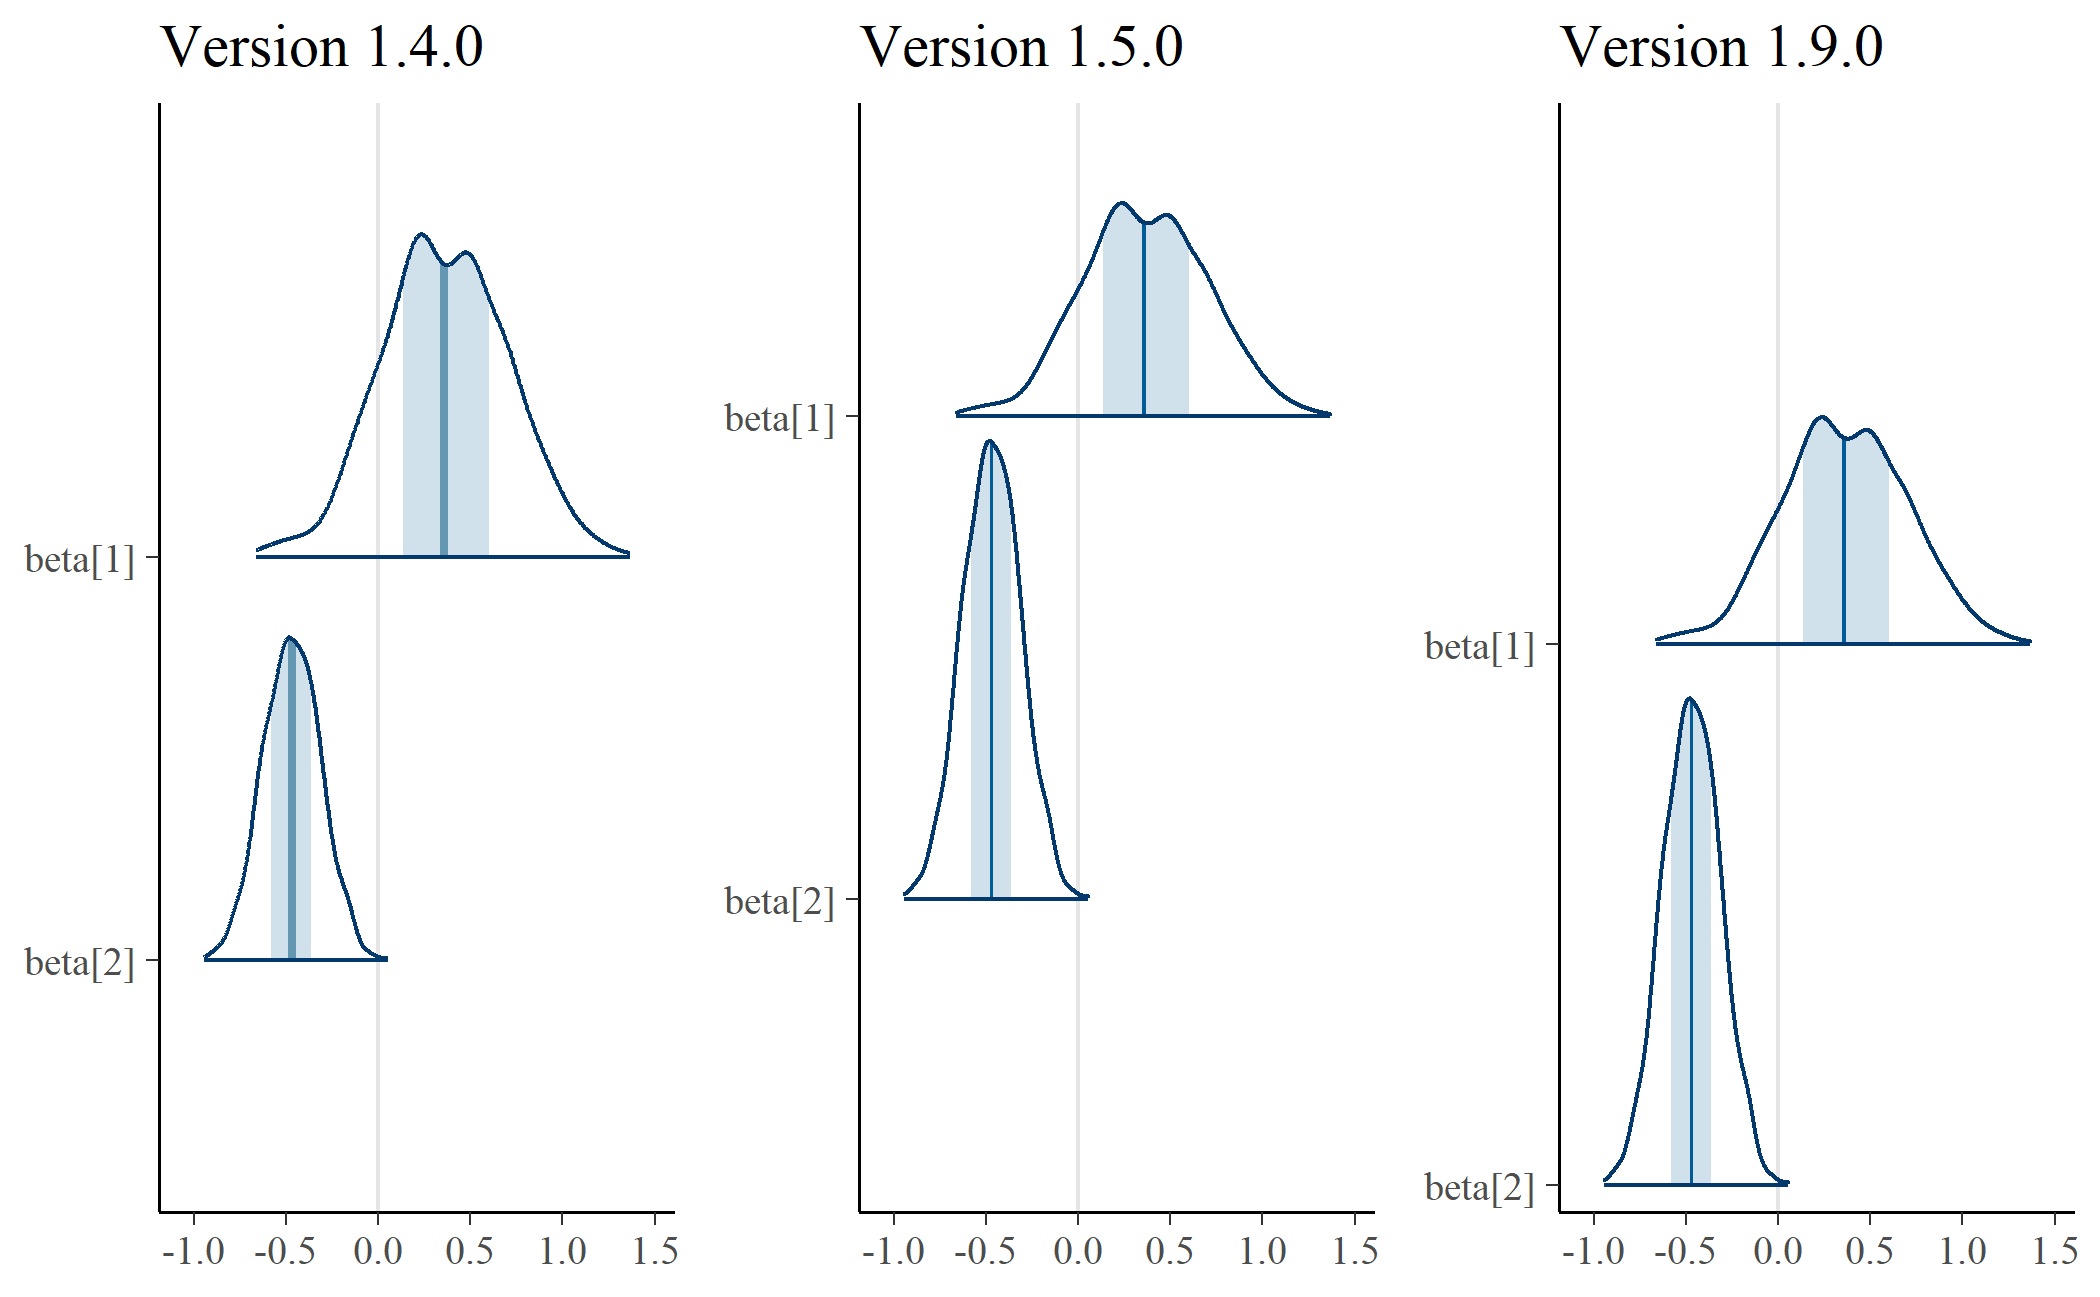
At the end of March, Jonah Gabry and I released bayesplot 1.5.0. The major additions to the package were visualizations using ridgelines and a new plot for PIT diagnostics from LOO validation. I don’t know what that LOO PIT thing is yet, so I’ll ta...
[Read more...]

R and TensorFlow Presentations

April 2, 2018 | R Views

In early March, the Bay Area useR Group was able to hold an R and TensorFlow mini-conference on Google’s new Sunnyvale campus. Pete Mohanty, a Stanford researcher and frequent BARUG speaker, lead off with a talk on his recent kerasformula package, which allows R users to call a keras-based ... [Read more...]

Fun with M&M’s – April 3, 2018

April 2, 2018 | Chuck Powell

In this post we’re going to explore the Chi Squared Goodness of Fit test using M&M’s as our subject material. From there we’ll take a look at simultaneous confidence intervals a.k.a. multiple comparisons. On the R side of things we’ll make use of ... [Read more...]

How Much Have People Made on Bitcoin?

April 2, 2018 | Sweiss' Blog

Intro: How much has bitcoin made Society? This post will calculate the realized gains of bitcoin (up to year 2013) as a measure of how much society has made off of bitcoin. How are realized gains different from market capitalization? Realized gains measure the amount of money people can claim to ...
[Read more...]

How to Visualize Data With Highcharter

April 2, 2018 | Euthymios Kasvikis

INTRODUCTION Highcharter is a R wrapper for Highcharts javascript libray and its modules. Highcharts is very mature and flexible javascript charting library and it has a great and powerful API1. The main features of this package are: Various chart type with the same style: scatters, bubble, line, time series, heatmaps, ...
[Read more...]

Digital Marketplace. Six months later.

April 2, 2018 | Carl Goodwin

Six months ago we considered the question: Is the Government realising its ambition for SMEs on G-Cloud? This article reviews progress six months later, additionally considering the Digital Outcomes & Specialists (DOS) framework. The post Digital Marketplace. Six months later. appeared first on thinkr.
[Read more...]

Visualizing geo-spatial data with sf and plotly

April 2, 2018 | Carson Sievert

Need help with R, data viz, and/or stats? Work with me or attend my 2 day workshop! In my last post, we explored interactive visualizations of simple features (i.e., interactive maps) via ggplot2’s geom_sf() and plotly’s ggplotly(). This time we’ll make similar visualizations using plotly’...
[Read more...]
1 12 13 14 15

Never miss an update!
Subscribe to R-bloggers to receive
e-mails with the latest R posts.
(You will not see this message again.)

Click here to close (This popup will not appear again)