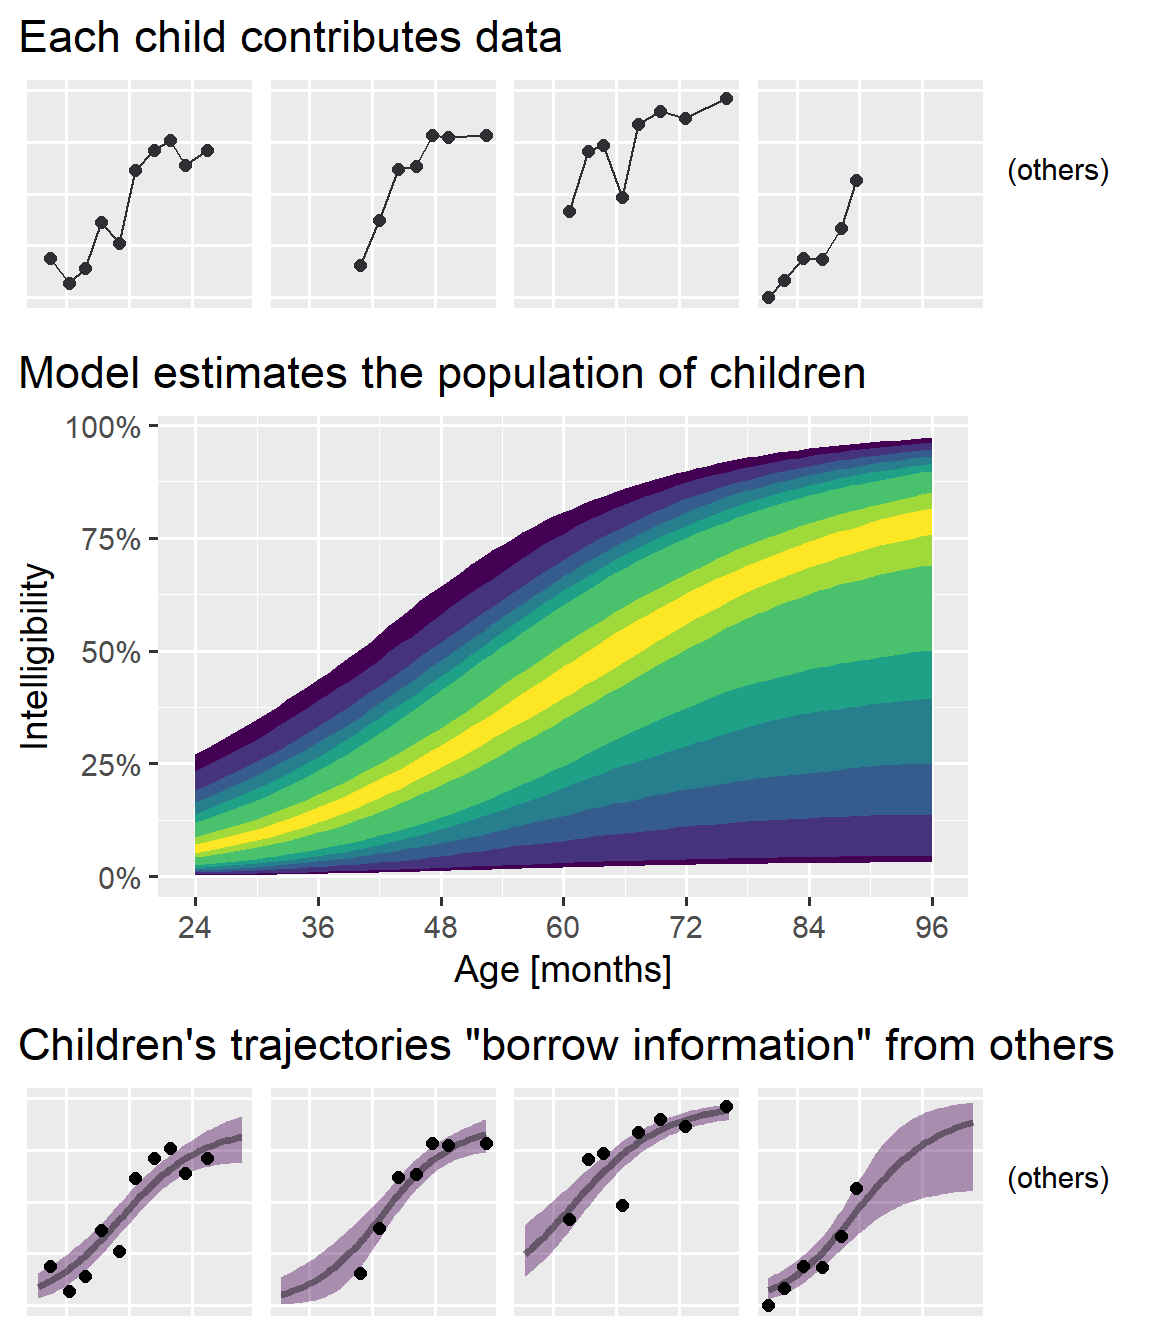
Notes on Citing R and R Packages
Our group has started using a new knowledge base system, so I have been
writing up and revisiting some of my documentation. Here I am going to
share a guide I wrote about citing R packages in academic writing.
Which software to cite
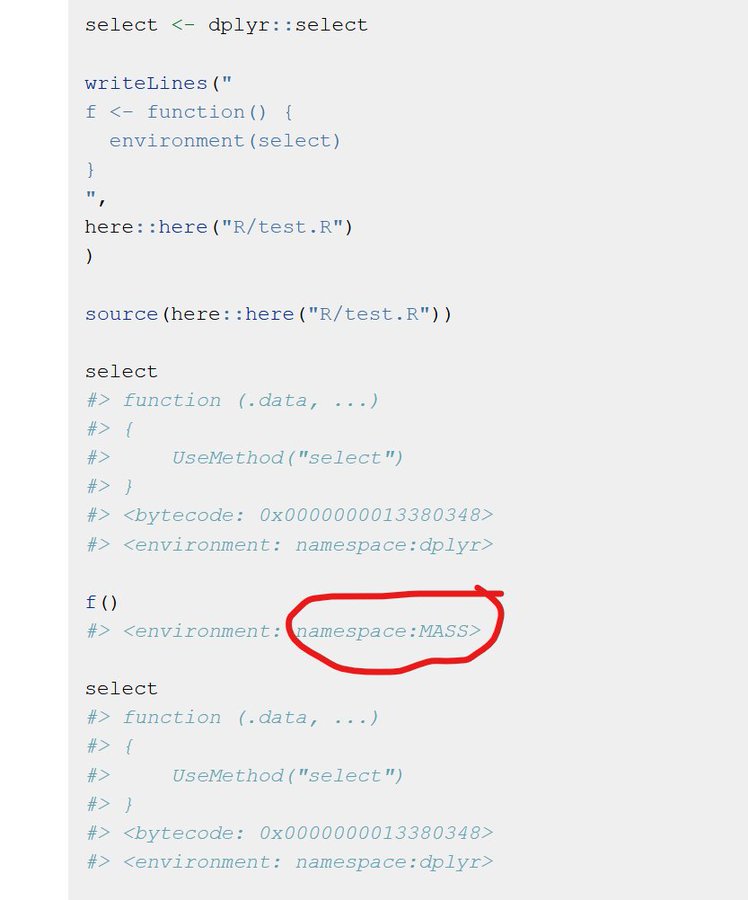
Let’s make a dist... [Read more...]