October 2017

Exploring Uncertainty with Bayesian ML

October 22, 2017 | Sweiss' Blog

Introduction: Bayesian machine learning techniques allow us to obtain a posterior density for individual predictions instead of just the mean. This additional information allows us to understand and explore the uncertainty involved. However not all un...
[Read more...]

The SeaClass R Package

October 22, 2017 | R Views

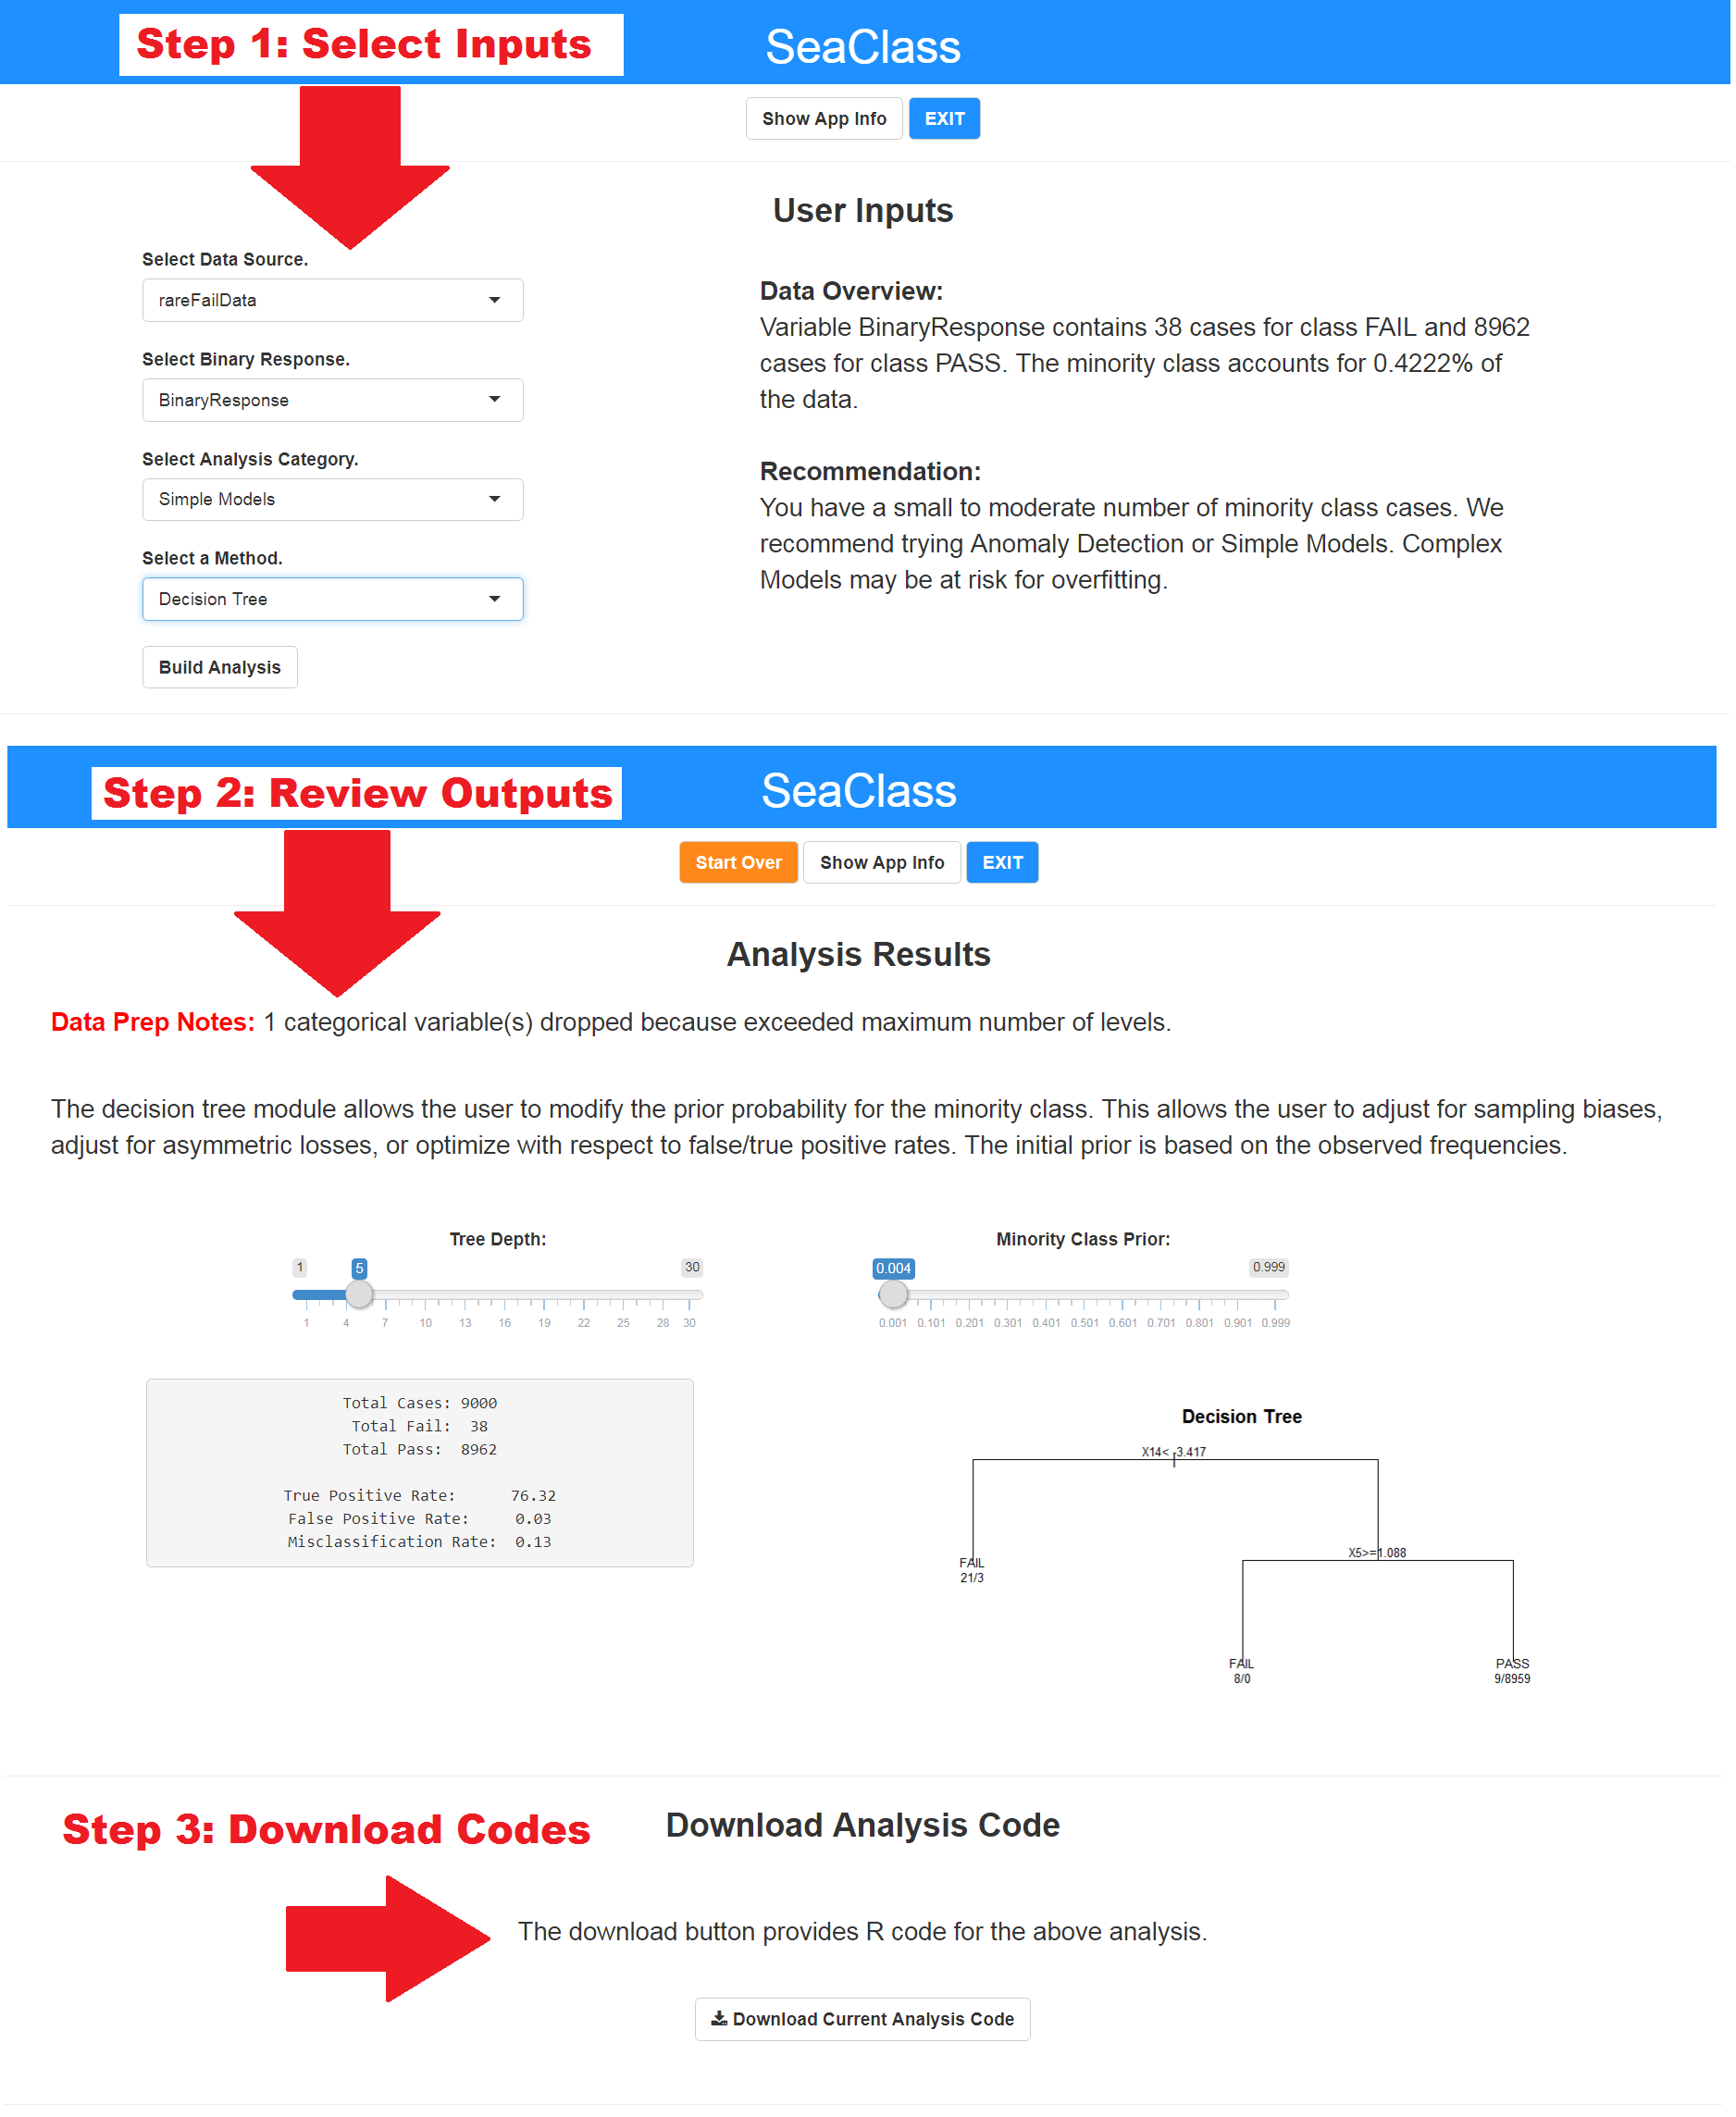
The SeaClass R Package The Operations Technology and Advanced Analytics Group (OTAAG) at Seagate Technology has decided to share an internal project that helps accelerate development of classification models. The interactive SeaClass tool is contained in an R-based package built using shiny and other CRAN packages commonly used for binary ...
[Read more...]

Who knew likelihood functions could be so pretty?

October 22, 2017 | Keith Goldfeld

I just released a new iteration of simstudy (version 0.1.6), which fixes a bug or two and adds several spline related routines (available on CRAN). The previous post focused on using spline curves to generate data, so I won’t repeat myself here. And, apropos of nothing really - I thought ...
[Read more...]

linl 0.0.1: linl is not Letter

October 22, 2017 | Thinking inside the box

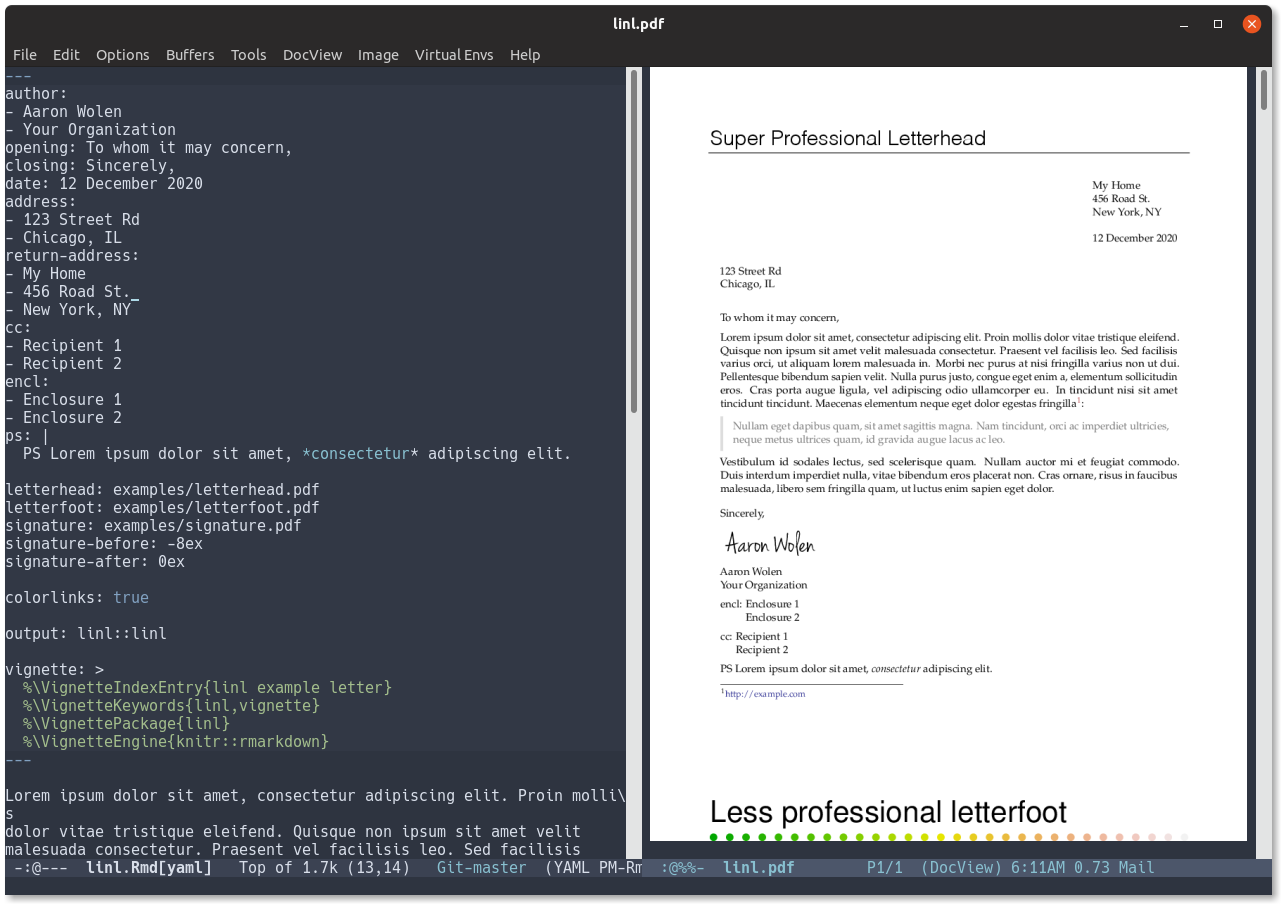
Aaron Wolen and I are pleased to announce the availability of the initial 0.0.1 release of our new linl package on the CRAN network. It provides a simple-yet-powerful Markdown---and RMarkdown---wrapper the venerable LaTeX letter class. Aaron had done...
[Read more...]

A Call to Tweets (& Blog Posts)!

October 22, 2017 | hrbrmstr

Way back in July of 2009, the first version of the twitteR package was published by Geoff Jentry in CRAN. Since then it has seen 28 updates, finally breaking the 0.x.y barrier into 1.x.y territory in March of 2013 and receiving it’s last update in July of 2015. For a very ... [Read more...]

Automatic Time-Series Forecasting with Prophet

October 21, 2017 | Computational Social Science

Seasonality and Trends Time-series analysis is a battle on multiple fronts by definition. One has to deal with (dynamic) trends, seasonality effects, and good old noise. A general formula can be given as
y = level + trend + seasonality + noise
However, the relationships between these factors can be realized in many, and sometimes quite complex, ways. ...
[Read more...]

Markets Performance after Election: Day 239

October 21, 2017 | quintuitive

When I wrote the original post, I wasn’t planning on writing a follow-up. Certainly not the week after. But what a difference a week can make in a dynamic system like the US stock market. While re-running the computations testing the latest version of RStudio, I noticed something surprising – ... [Read more...]
1 3 4 5 6 7 15

Never miss an update!
Subscribe to R-bloggers to receive
e-mails with the latest R posts.
(You will not see this message again.)

Click here to close (This popup will not appear again)