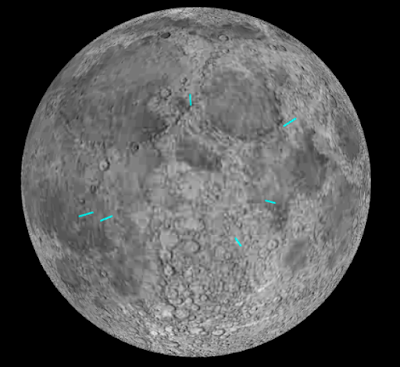
Welcome to the second in a series of posts of maps-to-places-I-am-unlikely-to-visit generated by R (the previous post is here).A bit-o NASA data, the R threejs library and a few lines of code can be used to create an interactive map that identifies the landing locations of Apollo lunar landing ...
As more and more organizations are setting up teams of data scientists to make sense of the massive amounts of data they collect, the need grows for a standardized process for managing the work of those teams. To help with this, the data science team at Microsoft has drawn on ... [Read more...]
It was a Saturday morning; I was lecturing my students of my Item Response Theory class when I decided to run some R scripts to introduce my students with the JAGS syntax and the estimation of parameters in a Bayesian logistic regression setup.As it wa...
One way analysis of variance helps us understand the relationship between one continuous dependent variable and one categorical independent variable. When we have one continuous dependent variable and more than one independent categorical variable we cannot use one way ANOVA. When we have two independent categorical variable we need to ... [Read more...]
The heatmaps are a tool of data visualization broadly widely used with biological data. The concept is to represent a matrix of values as colors where usually is organized by a gradient. We can find a large number of these graphics in scientific articles related with gene expressions, such as ... [Read more...]
.fusion-fullwidth-1 {
padding-left: px !important;
padding-right: px !important;
}by Joseph Rickert
Welcome to “R Views”, the new R Community blog from RStudio.... [Read more...]
Microsoft has been really increasing their development of tools in the predictive analytics and machine learning space. Another such tool they released recently is LightGBM. From the Github site...LightGBM is a fast, distributed, high performance gradient boosting (GBDT, GBRT, GBM or MART) framework based on decision tree algorithms, used ... [Read more...]
Probably, function paste is one of the most used function in R. The objective of this function is concatenate a series of strings. [crayon-58838298d6ebf491135746/] The arguments of the function are: [crayon-58838298d6ecf484406126/] … = The space to write the series of strings. sep = The element which separates every term. ... [Read more...]
For those of us who received statistical training outside of statistics departments, it often emphasized procedures over principles. This entailed that we learned about various statistical techniques and how to perform analysis in a particular statistical software, but glossed over the mechanisms and mathematical statistics underlying these practices. While that ... [Read more...]
The October meeting of the San Francisco Bay Area R User Group held at Santa Clara University consisted of socializing, an intro, and three speakers. In the intro, host representative Sanjiv Das highlighted the curriculum and advisory board of the school's new MS in Business Analytics program. The first speaker, ... [Read more...]
How do we know that marketing works? It was National Poetry Day in Britain recently, and I do believe that poetry and imagination, and the wisdom and insights it can bring, has a place in business and corporate world. But wisdom isn’t knowledge; it d... [Read more...]
David Rossell and Francisco Rubio (both from Warwick) arXived a month ago a paper on non-normal variable selection. They use two-piece error models that preserve manageable inference and allow for simple computational algorithms, but also characterise the behaviour of the resulting variable selection process under model misspecification. Interestingly, they show ...
A moment ago, Rcpp hit another milestone: 800 packages on CRAN now depend on it (as measured by Depends, Imports and LinkingTo declarations). The graph is on the left depicts the growth of Rcpp usage over time.
The easiest way to compute this is to ... [Read more...]
The V0.2 of D3partitionR is now available on gitlab ! (And will soon be available on the CRAN!) Changelog: New visualisation: collapsible tree Indented collapsible tree 2. New functionalities and improvement Shiny input: The partition charts can now be used as shiny input. Several inputs options are available: the clicked node, ... [Read more...]
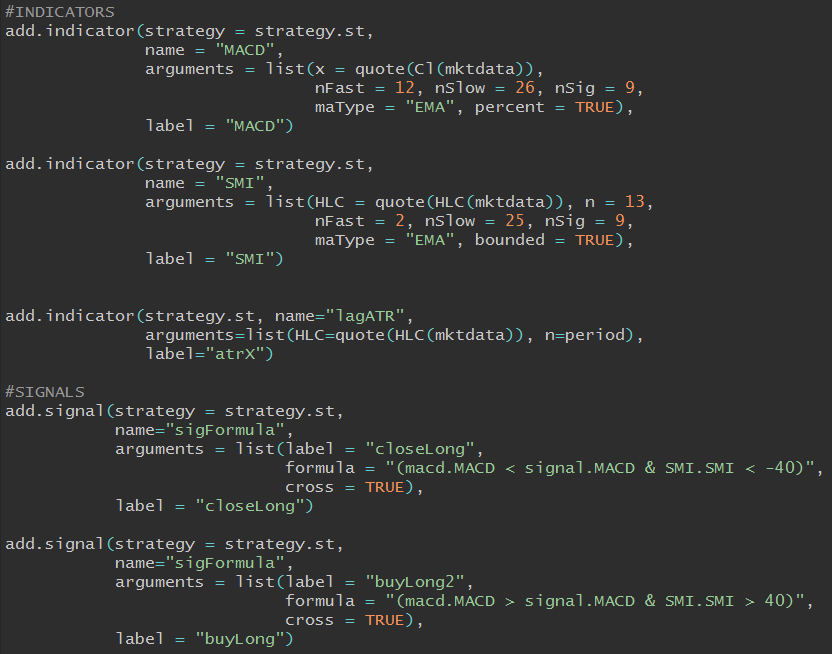
Finally a somewhat profitable strategy to analyze! This post will walk through the development of my MACD + SMI strategy, including my experience with parameter optimization and trailing stops. This strategy began with an interest in the Moving Average Convergence/Divergence oscillator (MACD), which I hadn’t yet explored. Also, since ...
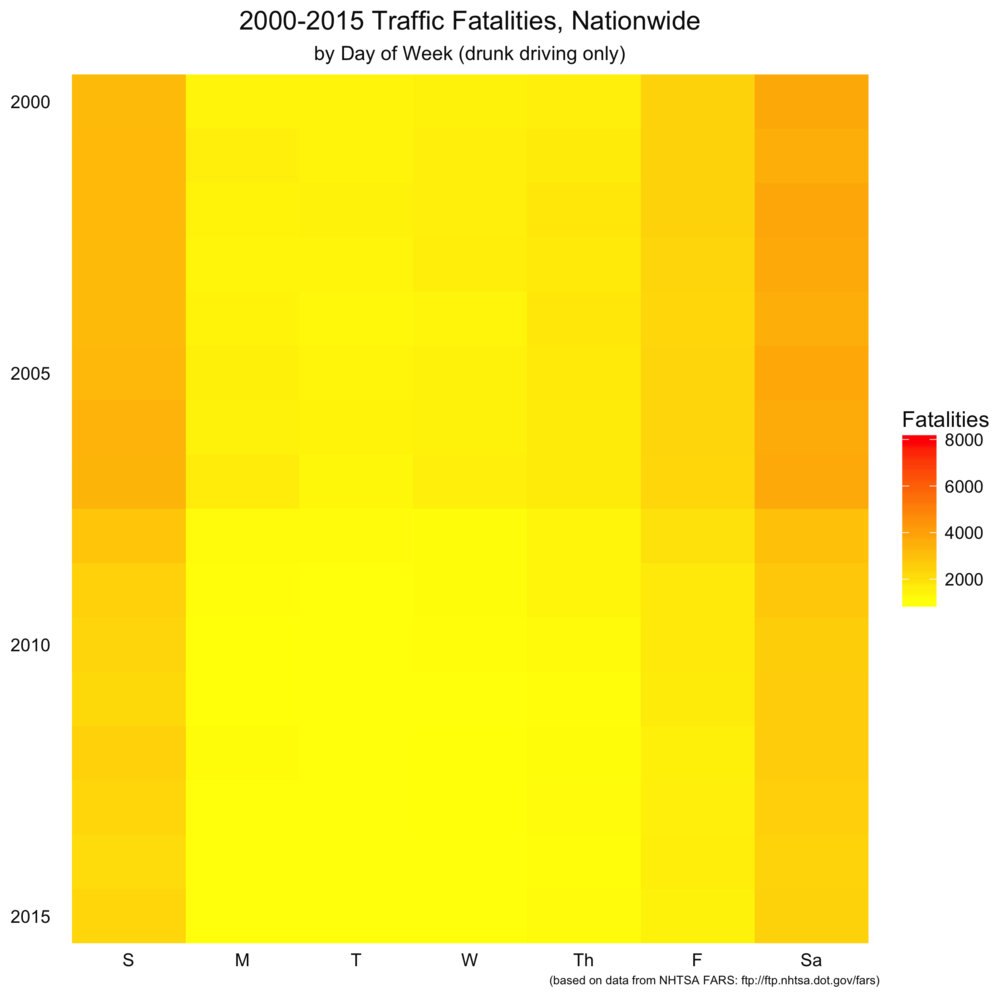
This is the latest post in a series analyzing Arkansas traffic fatalities. Please take a look at part 1 (a map of 2015 traffic deaths) and part 2 (a heat map of all fatalities, both nationwide and in Arkansas, from 200-2015) if you haven’t already. Visualizations Today’s visualization piggybacks off part 2, ... [Read more...]
This is the latest post in a series analyzing Arkansas traffic fatalities. Please take a look at part 1 (a map of 2015 traffic deaths) and part 2 (a heat map of all fatalities, both nationwide and in Arkansas, from 200-2015) if you haven't already.
Visualizations
Today's visualization piggybacks off part 2, in that ...
To stay on top of R in the news, we’re sharing some stories related to R published last week. A great interview with JJ Allaire, creator of RStudio.(Joseph Rickert) The man who build RStudio now 13 years ago shares some insight on the company and his own motivation. Or ... [Read more...]