Articles by Andrés Gutiérrez

Scatter plots in survey sampling

November 27, 2017 | Andrés Gutiérrez

You can find this post in Blogdown format by clicking hereWhen it comes to analyzing survey data, you have to take into account the stochastic structure of the sample that was selected to obtain the data. Plots and graphics should not be an exception. ...
[Read more...]

Automatic output format in Rmarkdown

November 19, 2017 | Andrés Gutiérrez

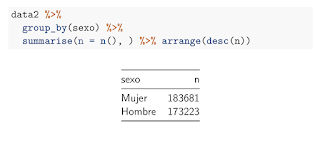
I am writing a Rmarkdown document with plenty of tables, and I want them in a decent format, e.g. kable. However I don't want to format them one by one. For example, I have created the following data frame in dplyrdata2 %__% group_by(uf) %__% sum...
[Read more...]

Small Area Estimation 101

April 16, 2017 | Andrés Gutiérrez

Small area estimation (SAE) has become a widely used technique in official statistics since the last decade of past century. When the sample size is not enough to provide reliable estimates at a very particular level, the power of models and auxiliary ... [Read more...]

Highlighting R code for the web

December 3, 2016 | Andrés Gutiérrez

When blogging about statistics and R, it is very useful to differentiate the body text to R code. I used to manage this issue by highlighting the code and pretty-R was a valuable instrument from Revolutions Analytics to accomplish this. However, as you... [Read more...]

How important is that variable?

December 3, 2016 | Andrés Gutiérrez

When modeling any phenomena by including explanatory variables that highly relates the variable of interest, one question arises: which of the auxiliary variables have a higher influence on the response? I am not writing about significance testing or s... [Read more...]

Lord’s Paradox in R

November 20, 2016 | Andrés Gutiérrez

In an article called A Paradox in the Interpretation of Group Comparisons published in Psychological Bulletin, Lord (1967) made famous the following controversial story:A university is interested in investigating the effects of the nutritional diet its...
[Read more...]

I don’t care about that lost unit

June 4, 2016 | Andrés Gutiérrez

Just assume that you have planned a survey along with the necessary sample size to obtain representativity. Let’s suppose the sample size is 100. However, as nonresponse is always present, unfortunately your effective sample size is 99. Consider the...
[Read more...]

Parametric bootstrap

August 7, 2015 | Andrés Gutiérrez

Assume we want to know the mean square error (MSE) of the sample median as a estimator of a population mean under normality. As you know, this is not a trivial problem. We may take advantage of the Bootstrap method and solve it by means of simulation.... [Read more...]

Never miss an update!
Subscribe to R-bloggers to receive
e-mails with the latest R posts.
(You will not see this message again.)

Click here to close (This popup will not appear again)