Articles by Nathan Chaney

Visualizing Arkansas traffic fatalities, Part 3

October 16, 2016 | Nathan Chaney

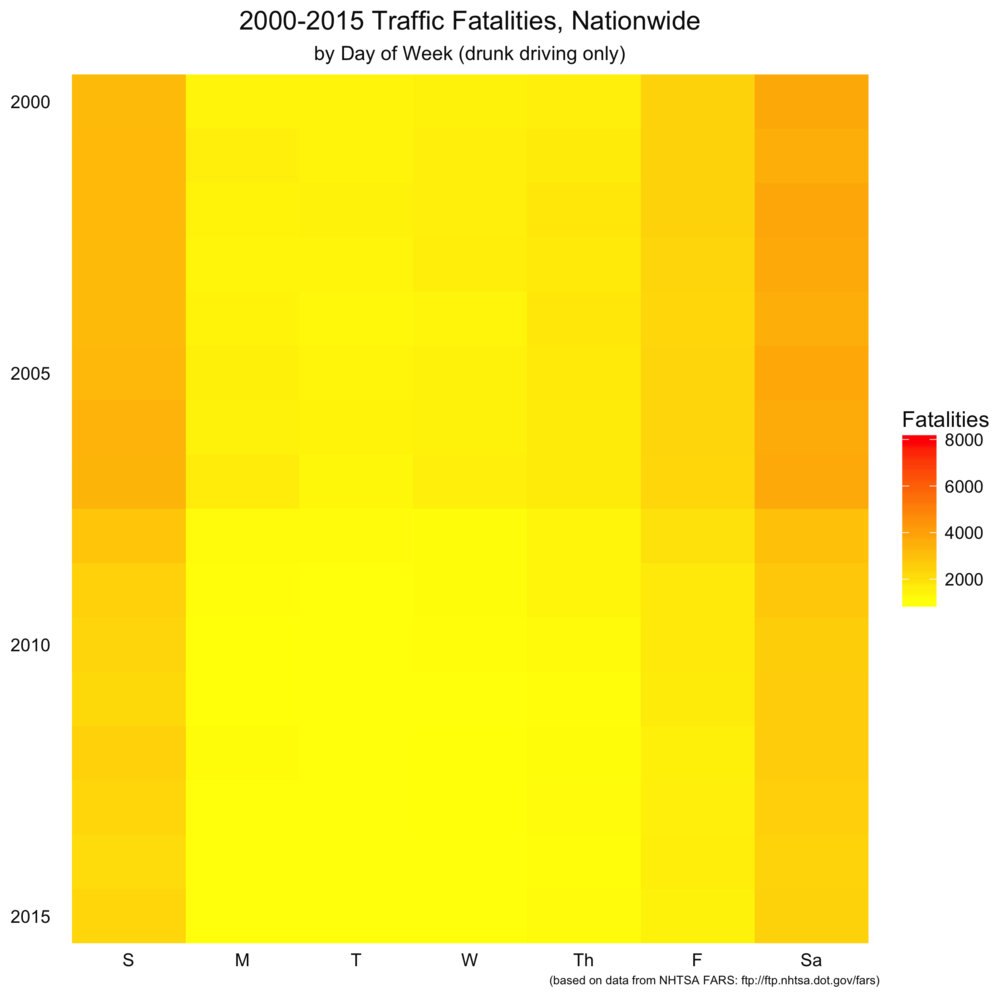
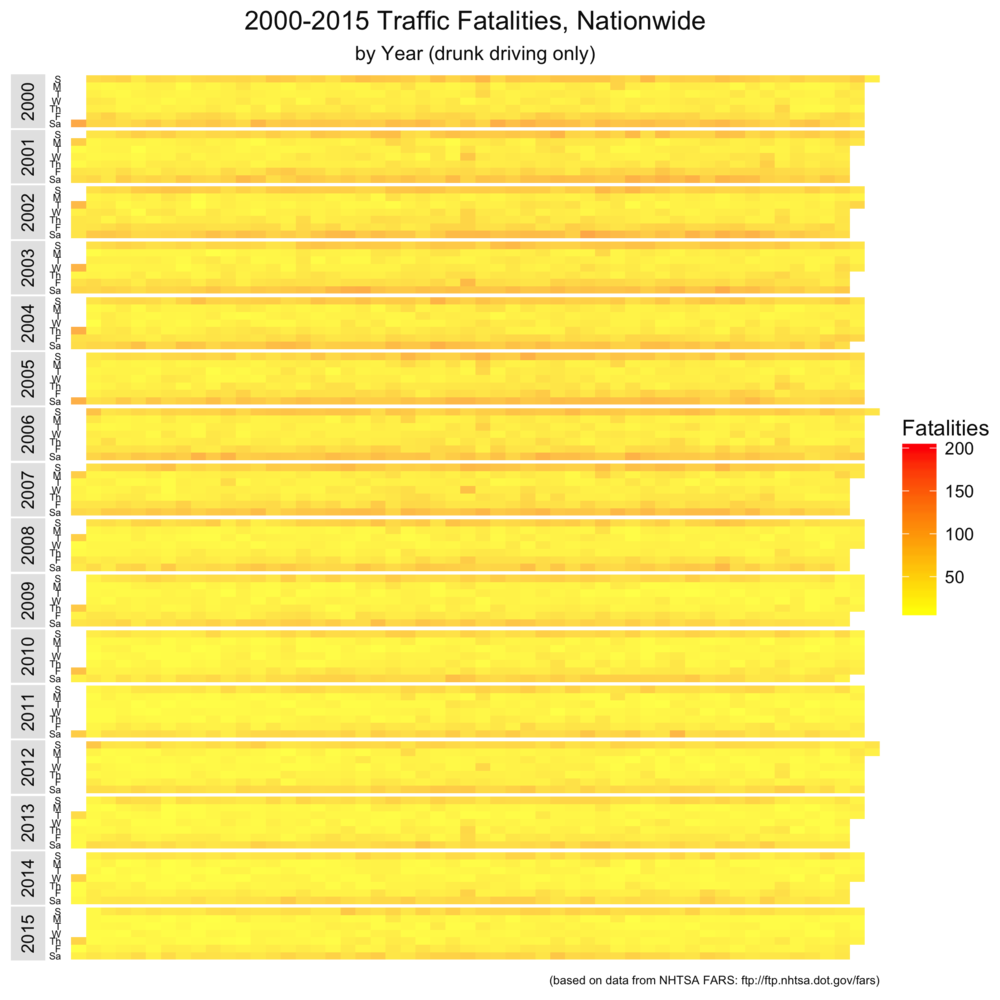
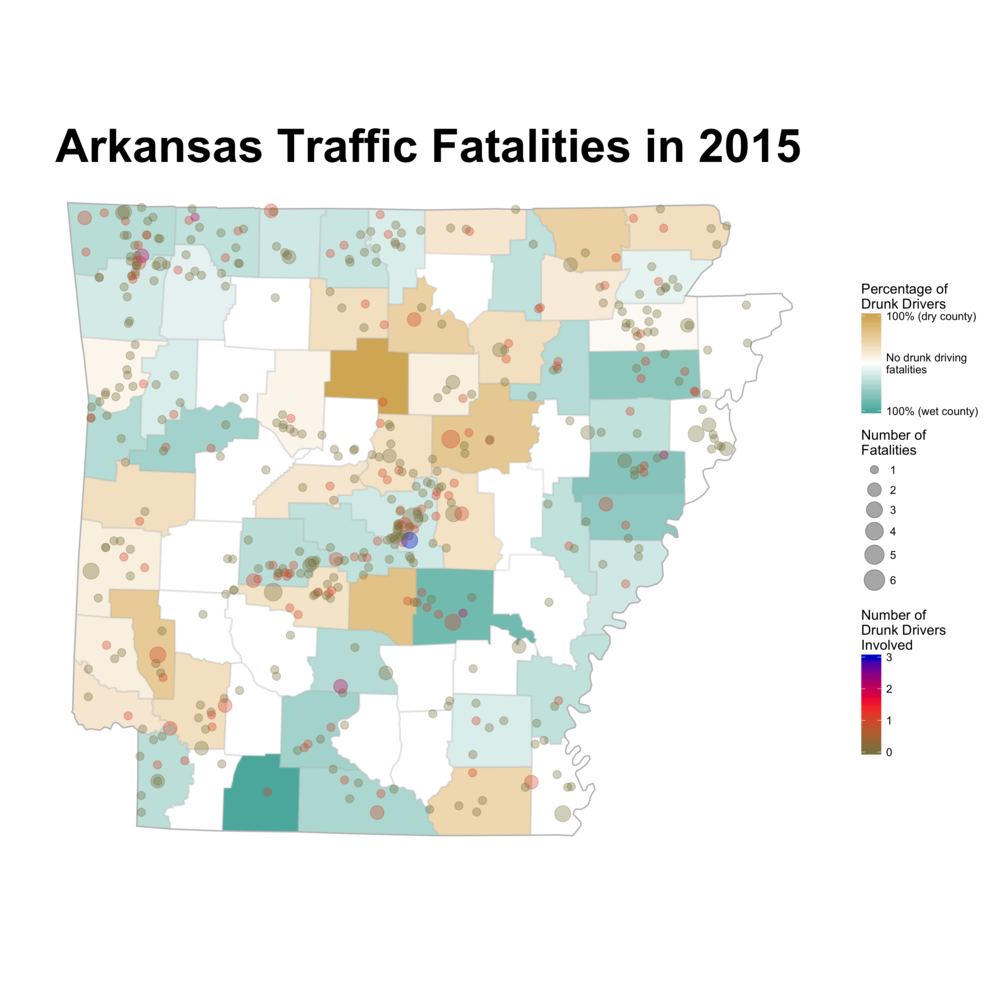
This is the latest post in a series analyzing Arkansas traffic fatalities. Please take a look at part 1 (a map of 2015 traffic deaths)  and part 2 (a heat map of all fatalities, both nationwide and in Arkansas, from 200-2015) if you haven't already. Visualizations Today's visualization piggybacks off part 2, in that ...
[Read more...]

Visualizing Arkansas traffic fatalities, Part 2

September 29, 2016 | Nathan Chaney

A couple of weeks ago, I posted a map of the traffic fatalities in Arkansas in 2015. The data came from the NHTSA, and the graphic I posted was just scratching the surface. I've sliced the data a couple of different ways and created three more sets of visualizations about that ...
[Read more...]

Visualizing Arkansas traffic fatalities

September 14, 2016 | Nathan Chaney

Nathan here again with another guest post. I recently started a master's program at UALR in information science, so I've been following several blogs on statistical programming and visualization. One of the best sites I've found is R-bloggers, which is dedicated to the popular statistical programming language R. A recent ...
[Read more...]

Never miss an update!
Subscribe to R-bloggers to receive
e-mails with the latest R posts.
(You will not see this message again.)

Click here to close (This popup will not appear again)