Articles by Stevie P

Base Graphics – The “Drunk Uncle”  of R ?

December 19, 2019 | Stevie P

As we move into the Holidays I’m reminded of the family reunions taking place the world over and how such encounters can sometimes lead to skirmishes initiated by unsolicited advice  – “Let me tell you what your problem is” or “When are you going to get a real job ?” While ...
[Read more...]

dplyr and Zika – Epilogue

July 19, 2016 | Stevie P

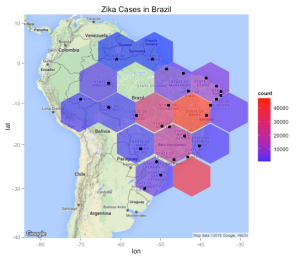
I really thought I was done with the Express dplyr series though on completion of the second part I received many messages requesting more examples of using dplyr with ggplot along with some other types of information such as the Zika virus data which can be downloaded from Github. These ...
[Read more...]

Express dplyr Part II

July 7, 2016 | Stevie P

This is Part II of the “Express dplyr” posting. If you haven’t already you might want to review Part I of this topic before proceeding although if you have some knowledge of dplyr then by all means proceed. Don’t worry – there are no tests ! In this second part ...
[Read more...]

Express Intro to dplyr

June 28, 2016 | Stevie P

Working The Data Like a Boss ! I recently introduced the data.table package which provides a nice way to manage and aggregate large data sources using the standard bracket notation that is commonly employed when manipulating data frames in R. As data sources grow larger one must be prepared with ...
[Read more...]

Intro to The data.table Package

June 14, 2016 | Stevie P

Data Frames R provides a helpful data structure called the “data frame” that gives the user an intuitive way to organize, view, and access data.  Many of the functions that you would use to read in external files (e.g. read.csv) or connect to databases (RMySQL), will return a ...
[Read more...]

Never miss an update!
Subscribe to R-bloggers to receive
e-mails with the latest R posts.
(You will not see this message again.)

Click here to close (This popup will not appear again)