Articles by kjytay

Documentation for internal functions

June 10, 2021 | kjytay

tl;dr: To avoid triple quotes and R CMD CHECK --as-cran errors due to documentation examples for internal functions, enclose the example code in \dontrun{}. I recently encountered an issue when submitting an R package to CRAN that I couldn’t find … Continue reading →
[Read more...]

Small gotcha when using negative indexing

May 26, 2021 | kjytay

Negative indexing is a commonly used method in R to drop elements from a vector or rows/columns from a matrix that the user does not want. For example, the code below drops the third column from the matrix M: Now, … Continue reading → [Read more...]

Introducing cvwrapr for your cross-validation needs

May 25, 2021 | kjytay

TLDR: I’ve written an R package, cvwrapr, that helps users to cross-validate hyperparameters. The code base is largely extracted from the glmnet package. The R package is available for download from Github, and contains two vignettes which demonstrate how to … Continue reading →
[Read more...]

What is the Tukey loss function?

April 23, 2021 | kjytay

The Tukey loss function The Tukey loss function, also known as Tukey’s biweight function, is a loss function that is used in robust statistics. Tukey’s loss is similar to Huber loss in that it demonstrates quadratic behavior near the origin. … Continue reading →
[Read more...]

Is the EPL getting more unequal?

April 11, 2021 | kjytay

I recently heard that Manchester City were so far ahead in the English Premier League (EPL) that the race for first was basically over, even though they were still about 6-7 more games to go (out of a total of … Continue reading →
[Read more...]

Estimating pi using the method of moments

March 14, 2021 | kjytay

Happy Pi Day! I don’t encounter very much in my area of statistics, so this post might seem a little forced… In this post, I’m going to show one way to estimate . The starting point is the integral identity … Continue reading →
[Read more...]

What is a sunflower plot?

February 4, 2021 | kjytay

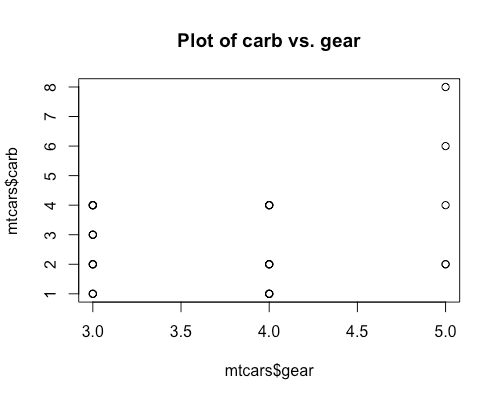
A sunflower plot is a type of scatterplot which tries to reduce overplotting. When there are multiple points that have the same (x, y) values, sunflower plots plot just one point there, but has little edges (or “petals”) coming out … Continue reading →
[Read more...]

covidcast package for COVID-19-related data

January 21, 2021 | kjytay

(This is a PSA post, where I share a package that I think that might be of interest to the community but I haven’t looked too deeply into myself.) Today I learnt of the covidcast R package, which provides access … Continue reading →
[Read more...]

The Mendoza line

January 20, 2021 | kjytay

The Mendoza Line is a term from baseball. Named after Mario Mendoza, it refers to the threshold of incompetent hitting. It is frequently taken to be a batting average of .200, although all the sources I looked at made sure … Continue reading →
[Read more...]

A shiny app for exploratory data analysis

December 22, 2020 | kjytay

I recently learnt how to build basic R Shiny apps. To practice using Shiny, I created a simple app that you can use to perform simple exploratory data analysis. You can use the app here to play around with the … Continue reading →
[Read more...]

Some notes when using dot-dot-dot (…) in R

November 14, 2020 | kjytay

When writing functions R, the ... argument is a special argument useful for passing an unknown number of arguments to another function. This is widely used in R, especially in generic functions such as plot(), print(), and apply(). Hadley Wickham’s … Continue reading → [Read more...]

Attributes in R

October 19, 2020 | kjytay

In R, objects are allowed to have attributes, which is a way for users to tag additional information to an R object. There are a few reasons why one might want to use attributes. One reason that I encountered recently … Continue reading → [Read more...]

Simulating paths from a random walk

September 9, 2020 | kjytay

If you’ve ever visited this blog at wordpress.com, you might have noticed a header image that looks like this: Ever wonder how it was generated? The image depicts 100 simulations of an asymmetric random walk. In this post, I’ll go … Continue reading →
[Read more...]
1 2 3 4 5

Never miss an update!
Subscribe to R-bloggers to receive
e-mails with the latest R posts.
(You will not see this message again.)

Click here to close (This popup will not appear again)