Drawing the wrong conclusion about subgroups: a comparison of Bayes and frequentist methods
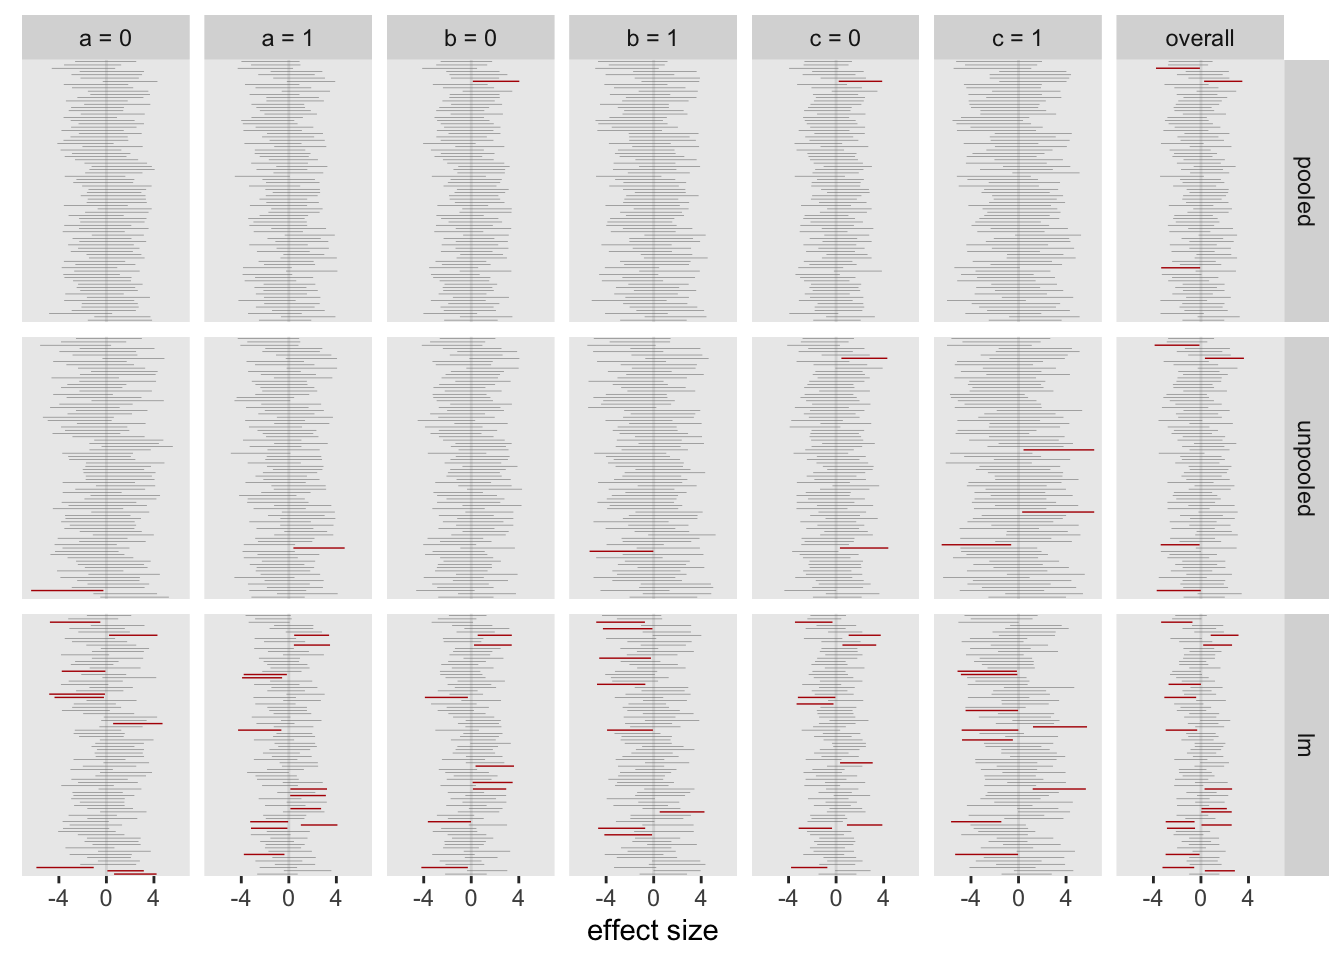
In the previous post, I simulated data from a hypothetical RCT that had heterogeneous treatment effects across subgroups defined by three covariates. I presented two Bayesian models, a strongly pooled model and an unpooled version, that could be us...