2021
Visit for the most up-to-date information on Data Science, employment, and tutorials finnstats.
If you want to read the original article, go here Sample and Population Variance in R
Sample and Population Variance in R, The variance is a metric for determining how dispersed data values are around the mean. ... [Read more...]
triple ruin
An almost straightforward riddle from The Riddler involving a triple gambler’s ruin: Dawn competes against three players Alessandra, Berenike, and Chinue, with probabilities of winning one round ¾, ½, and ¼, respectively, until the cumulated score reaches ±15, ±30, and ±45, for the first, second, and third games. What is Dawn’s optimal sequence of ... [Read more...]
How the Lagos R User Group Has Leveraged the Pandemic
Folajimi Aroloye is a data analytics professional and educator. He is the organizer for the Lagos R User Group. He is involved in capacity building. Folajimi started his data science...
The post How the Lagos R User Group Has Leveraged the Pandemic appeared first on R Consortium.

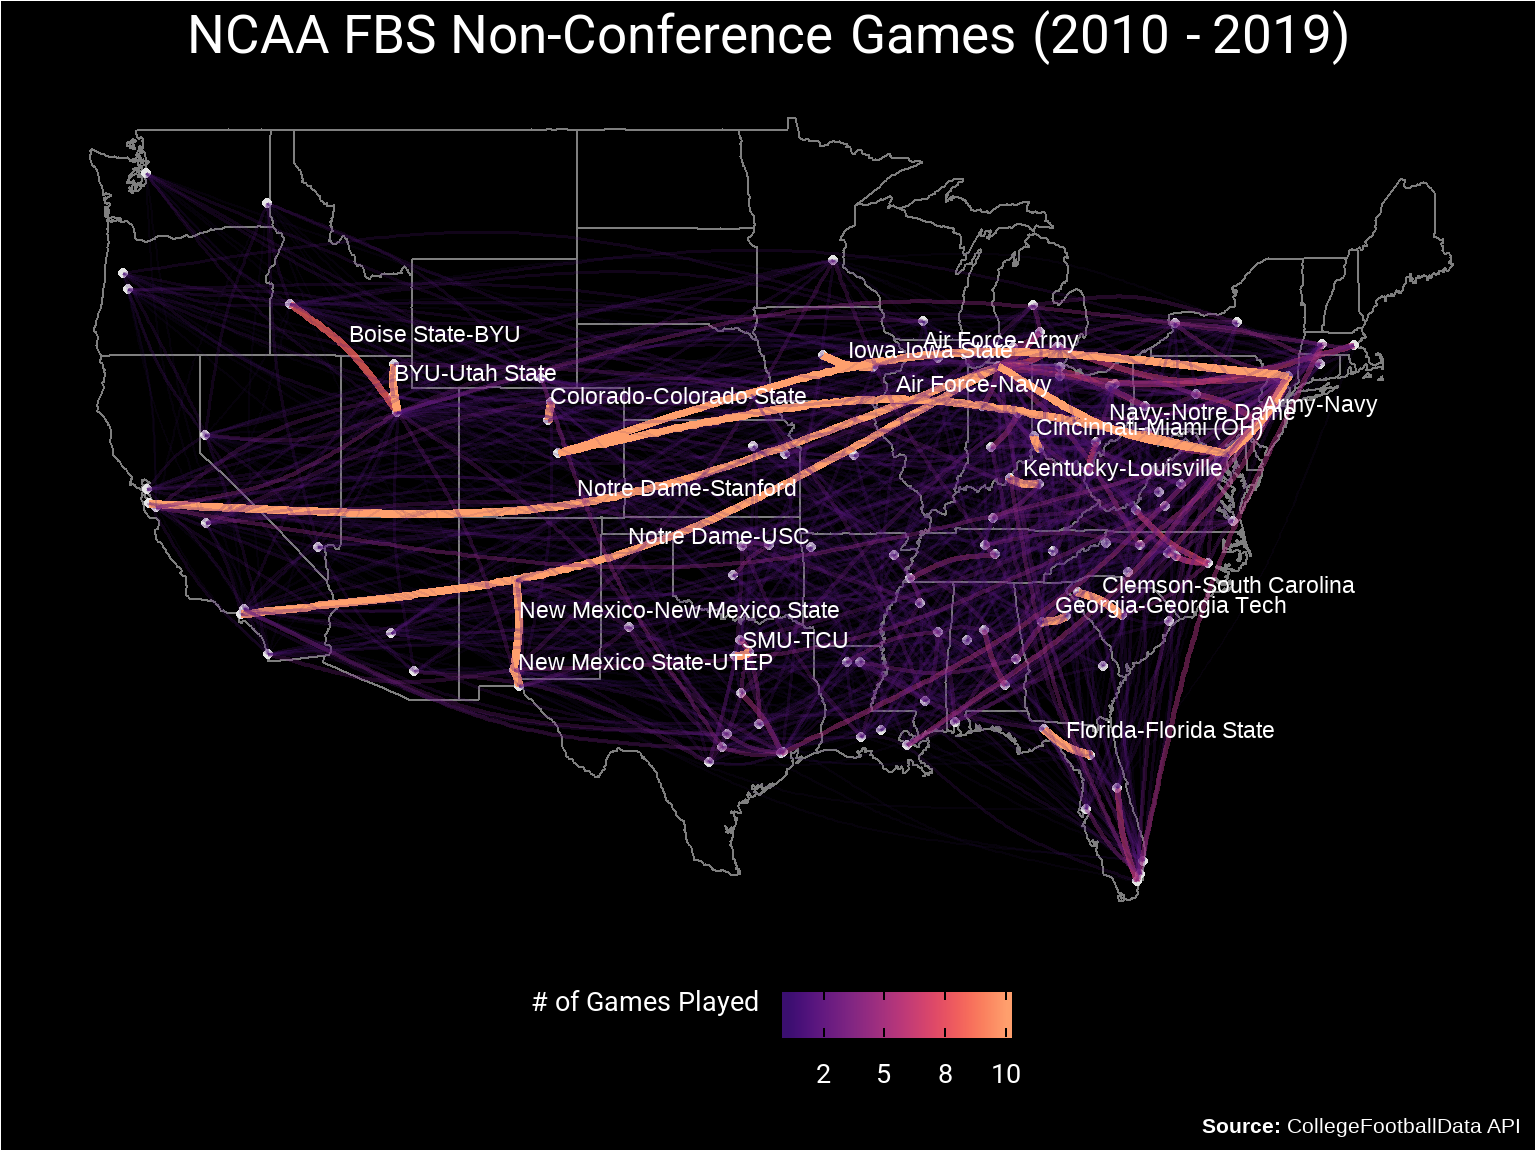
Exploring College Football Non-Conference Rivalries with {ggraph}
We’re in the middle of College Football’s bowl post-season and I’d been wanting to do a more in-depth post on networks using {tidygraph} and {ggraph} for a while. So now seemed like as good a time as any to explore some College Football data. I had used {...

How to Read Sourav Chatterjee’s Basic XICOR Definition
Introduction Professor Sourav Chatterjee recently published a new coefficient of correlation called XICOR (refs: JASA, R package, Arxiv, Hacker News, and a Python package (different author)). The basic formula (in the tie-free case) is: Take X and Y as n-vectors of observations of random variable. Compute the ranks r(i) ... [Read more...]
Advent of 2021, Day 25 – Spark literature, documentation, courses and books
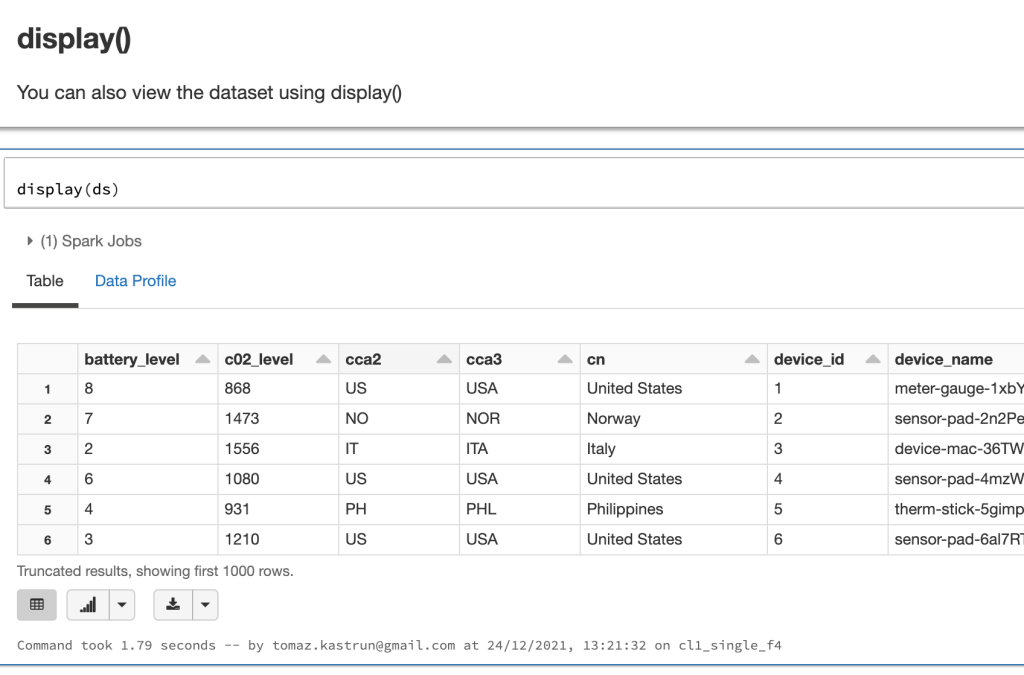
Series of Apache Spark posts: Dec 01: What is Apache Spark Dec 02: Installing Apache Spark Dec 03: Getting around CLI and WEB UI in Apache Spark Dec 04: Spark Architecture – Local and cluster mode Dec 05: Setting up Spark Cluster Dec 06: Setting up IDE Dec…Read more ›

Vector Error Correction Model (VECM) using R
This post explains how to estimate and forecast a Vector Error Correction Model (VECM) model using R. The VECM model consists of VAR model (short-term dynamics) and cointegration (long-term comovement). We use the Johansen cointegration test. The co...

Advent of 2021, Day 24 – Data Visualisation with Spark
Series of Apache Spark posts: Dec 01: What is Apache Spark Dec 02: Installing Apache Spark Dec 03: Getting around CLI and WEB UI in Apache Spark Dec 04: Spark Architecture – Local and cluster mode Dec 05: Setting up Spark Cluster Dec 06: Setting up IDE Dec…Read more ›

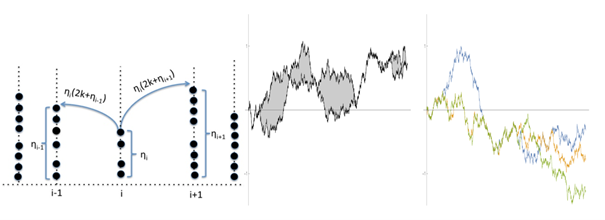
Inclusion Process and Sticky Brownian Motions
Inclusion Process and Sticky Brownian Motions
The ninth “One World webinar” organized by YoungStatS will take place on
February 9th, 2022. Inclusion process (IP) is a stochastic lattice gas
where particles perform random walks subjected to mutual ...

Target II: Monitoring a running goal in R
As 2021 draws to a close, it’s time to check back in on a previous post. As a recap, Garmin Connect offered four challenges to run 3 x 505 km and 1 x 505 km, one in each of the four quarters of 2021. Completing all four would mean running 2021 km in 2021. I […]

Analyzing player performance with animated charts!
Analytics is by definition, the science (& art) of identifying, discovering and interpreting patterns in data. There are different ways of capturing these patterns through charts (bar, pie, cumulative data, moving average etc.). One such way is the motion or animated chart which captures the changes in data across different time ... [Read more...]
Analysing seed germination and emergence data with R: a tutorial. Part 5
This is a follow-up post. If you are interested in other posts of this series, please go to: https://www.statforbiology.com/tags/drcte/
Comparing germination/emergence for several seed lots
Very often, seed scientists need to compare the germinati...

Adventures in x86 ASM with rx86
I just finished ‘Code: The Hidden Language of Computer Hardware and Software’ by Charles Petzold which was a really well-written (in my opinion) guided journey from flashing a light in morse code through to building a whole computer, and everything needed along the way.
The section on encoding instructions for ...

R-Ladies Lagos on Data Visualization and Hybrid Events
Alimi Eyitayo is a Graduate of Computer Engineering and a social engineering professional with over 12 years of experience in the field of information technology. She is an international speaker...
The post R-Ladies Lagos on Data Visualization and Hybrid Events appeared first on R Consortium.
Gold-Mining Week 16 (2021)
Week 16 Gold Mining and Fantasy Football Projection Roundup now available.
The post Gold-Mining Week 16 (2021) appeared first on Fantasy Football Analytics.
[Read more...]
Remote R Shiny Developer Jobs
The R Shiny space is growing! And as more companies switch to the convenience of control with Shiny’s customizability, Appsilon looks to expand with new remote R Shiny developer positions. Whether you’re starting your career in R or want to improve as a Shiny developer, continue reading to ...

RStudio Connect 2021 Year in Review
RStudio Connect Highlights for Data Scientists
It’s been a busy year for the RStudio Connect team. In case you missed it, here is a quick summary of the most interesting product highlights for RStudio Connect Publishers:
Content curation with th...

Thinking about maps and ice cream
In November 2021, I took part in the third edition of the 30 Day Map
Challenge created by Topi Tjukanov.
Participants are given a theme for each day of November, and are tasked
with creating a map...

New Data Science Degree in Zimbabwe Universities Fueling Interest and Growth in R Programming
R consortium had a discussion with Asimbongeni Dhlodhlo, one of the key leaders spearheading the ZimR UseRs group in Zimbabwe. He talks on how the COVID-19 pandemic has affected them...
The post New Data Science Degree in Zimbabwe Universities Fueling Interest and Growth in R Programming appeared first on R ...

Package modEvA 3.0 is now on CRAN!
This version of R package “model Evaluation and Analysis” includes some bug fixes (thanks to Huijie Qiao, Ying-Ju Tessa Chen, Oswald van Ginkel and Alba Estrada), some new functions (predPlot, confusionLabel, and mod2obspred, which is now used internally by several … Continue reading →

Copyright © 2022 | MH Corporate basic by MH Themes