Vector Error Correction Model (VECM) using R
[This article was first published on K & L Fintech Modeling, and kindly contributed to R-bloggers]. (You can report issue about the content on this page here)
Want to share your content on R-bloggers? click here if you have a blog, or here if you don't.
This post explains how to estimate and forecast a Vector Error Correction Model (VECM) model using R. The VECM model consists of VAR model (short-term dynamics) and cointegration (long-term comovement). We use the Johansen cointegration test. The coverage of this post is just a small island of the vast VECM modeling world. Want to share your content on R-bloggers? click here if you have a blog, or here if you don't.
Vector Error Correction Model
Key Takeaways for Cointegration, VECM, VAR
In general, when variables are non stationary, a VAR model in levels is not appropriate since it is a spurious regression which is a non-interpretable regression. However, although variables are non stationary but when cointegrations exist, a VAR model in levels can be estimated which has a long-term interpretation. In other words, the cointegration indicates one or more long-run equilibriums or stationary relationships among non-stationary variables.
To determine whether VAR model in levels is possible or not, we need to transform VAR model in levels to a VECM model in differences (with error correction terms), to which the Johansen test for cointegration is applied.
In other words, we take the following 4 steps
|
in case of 4), the VAR in differences is equal to the VECM model in differences (with no error correction term) since error correction terms does not exist.
In R package, the above steps are implemented in the following way.
|
While 4) provides the estimated parameters of VECM model, urca R package provides no function regarding prediction or forecasting. Instead, we use the predict() function in vars R package like 5) and 6). Indeed, for the forecasting purpose, we don’t have to use the cajorls() function since the vec2var() function can take the ca.jo() output as its argument.
Of course, 4), 5), 6) can also be implemented by using the following VECM() function in the tsDyn R package alternatively.
|
Cointegration
When \(x_t\) and \(y_t\) are nonstationary (\(I(1)\)) and if there is a \(\theta\) such that \(y_t – \theta x_t\) is stationary (\(I(0)\)), \(x_t\) and \(y_t\) are cointegrated. In other words, although each time series is nonstationary but its linear combination may be stationary. In this case, the cointegration is help the model estimation by augmenting short-run dynamics with long-run equilibriums.
Cointegration test is done by the ca.jo() function in the urca library.
VECM Model
As explained in the previous post, when all variables are non-stationary in level (\(X_t\)) and there are some cointegrations in level(\(\Pi X_{t}\)), we use a VECM model which consists of a VAR with stationary growth variables (\(\Delta X_t\)) and error correcting equations with non-stationary level variables (\(X_t\)).
VECM describes a short-run dynamics by vector autoregression (VAR) as well as a long-run equilibrium by error correcting equations.
\[\begin{align} \Delta X_t = \Pi X_{t-1} + \sum_{i=1}^{p-1}\Gamma_i \Delta X_{t-i} + CD_t + \epsilon_t \end{align}\]
where \(\Delta x\) is the first difference of \(x\), \(\Pi\) is a coefficient matrix of cointegrating relationships. \(\Gamma_i\) is a coefficient matrix of \(\Delta x_{t-i}\), C is a coefficient matrix of a vector of deterministic terms \(d_t\). \(\epsilon_t\) is an error term with mean zero and variance-covariance matrix \(\Sigma\).
\(\Pi X_{t-1}\) is the first lag of linear combinations of non-stationary level variables or error correction terms (ECT) which represent long-term relationships among non-stationary level variables.
For example, a tri-variate VECM(2) model is represented in the following way.
\[\begin{align} \begin{bmatrix} \Delta x_t \\ \Delta y_t \\ \Delta z_t \end{bmatrix} &= \begin{bmatrix} \pi_{11} & \pi_{12} & \pi_{13} \\ \pi_{21} & \pi_{22} & \pi_{23} \\ \pi_{31} & \pi_{32} & \pi_{33} \end{bmatrix} \begin{bmatrix} x_{t-1} \\ y_{t-1} \\ z_{t-1} \end{bmatrix} \\ &+\begin{bmatrix} \gamma_{11}^1 & \gamma_{12}^1 & \gamma_{13}^1 \\ \gamma_{21}^1 & \gamma_{22}^1 & \gamma_{23}^1 \\ \gamma_{31}^1 & \gamma_{32}^1 & \gamma_{33}^1 \end{bmatrix} \begin{bmatrix} \Delta x_{t-1} \\ \Delta y_{t-1} \\ \Delta z_{t-1} \end{bmatrix} \\ &+\begin{bmatrix} \gamma_{11}^2 & \gamma_{12}^2 & \gamma_{13}^2 \\ \gamma_{21}^2 & \gamma_{22}^2 & \gamma_{23}^2 \\ \gamma_{31}^2 & \gamma_{32}^2 & \gamma_{33}^2 \end{bmatrix} \begin{bmatrix} \Delta x_{t-2} \\ \Delta y_{t-2} \\ \Delta z_{t-2} \end{bmatrix} \\ &+\begin{bmatrix} c_{11} & c_{12} \\ c_{21} & c_{22} \\ c_{31} & c_{32} \end{bmatrix} \begin{bmatrix} 1 \\ d_{t} \end{bmatrix} +\begin{bmatrix} \epsilon_{xt} \\ \epsilon_{yt} \\ \epsilon_{zt} \end{bmatrix} \end{align}\]
\(\Pi X_{t-1}\) is the first lag of linear combinations of non-stationary level variables or error correction terms (ECT) which represent long-term relationships among non-stationary level variables.
In particular, the above cointegrating vector (\(\Pi\)) is not unique and is interpreted as a kind of combined coefficient, it is decomposed into 1) a cointegration or equilibrium matrix (\(\beta\)) and 2) a loading or speed matrix (\(\alpha\)) as follows. \[\begin{align} \Pi = \alpha \beta^{‘} \end{align}\] Its identification depends on the number of cointegration in the following way.
0) r = 0 (no cointegration)
In the case of no cointegration, since all variables are non-stationary in level, the above VECM model reduces to a VAR model with growth variables.
1) r = 1 (one cointegrating vector)
\[\begin{align} \Pi X_{t} &= \begin{bmatrix} \pi_{11} & \pi_{12} & \pi_{13} \\ \pi_{21} & \pi_{22} & \pi_{23} \\ \pi_{31} & \pi_{32} & \pi_{33} \end{bmatrix} \begin{bmatrix} x_{t} \\ y_{t} \\ z_{t} \end{bmatrix} \\ &= \begin{bmatrix} \alpha_{11} \\ \alpha_{21} \\ \alpha_{31} \end{bmatrix} \begin{bmatrix} 1 & – \beta_{11} & – \beta_{12} \end{bmatrix} \begin{bmatrix} x_t \\ y_t \\ z_t \end{bmatrix} \\ &= \begin{bmatrix} \alpha_{11} \\ \alpha_{21} \\ \alpha_{31} \end{bmatrix} \begin{bmatrix} 1 \\ – \beta_{11} \\ – \beta_{12} \end{bmatrix}^{‘} \begin{bmatrix} x_t \\ y_t \\ z_t \end{bmatrix} = \alpha \beta^{‘} X_t \\ &= \begin{bmatrix} \alpha_{11} \\ \alpha_{21} \\ \alpha_{31} \end{bmatrix} \begin{bmatrix} x_{t} – \beta_{11} y_{t} – \beta_{12} z_{t} \end{bmatrix} = \alpha EC_t \end{align}\]2) r = 2 (two cointegrating vectors)
\[\begin{align} \Pi X_{t} &= \begin{bmatrix} \pi_{11} & \pi_{12} & \pi_{13} \\ \pi_{21} & \pi_{22} & \pi_{23} \\ \pi_{31} & \pi_{32} & \pi_{33} \end{bmatrix} \begin{bmatrix} x_{t} \\ y_{t} \\ z_{t} \end{bmatrix} \\ &= \begin{bmatrix} \alpha_{11} & \alpha_{12} \\ \alpha_{21} & \alpha_{22} \\ \alpha_{31} & \alpha_{32} \end{bmatrix} \begin{bmatrix} 1 & – \beta_{11} & – \beta_{12} \\ 1 & – \beta_{21} & – \beta_{22} \end{bmatrix} \begin{bmatrix} x_t \\ y_t \\ z_t \end{bmatrix} \\ &= \begin{bmatrix} \alpha_{11} & \alpha_{12} \\ \alpha_{21} & \alpha_{22} \\ \alpha_{31} & \alpha_{32} \end{bmatrix} \begin{bmatrix} 1 & 1 \\ – \beta_{11} & – \beta_{21} \\ – \beta_{12} & – \beta_{22} \end{bmatrix}^{‘} X_t = \alpha \beta^{‘} X_t \\ &= \begin{bmatrix} \alpha_{11} & \alpha_{12} \\ \alpha_{21} & \alpha_{22} \\ \alpha_{31} & \alpha_{32} \end{bmatrix} \begin{bmatrix} x_{t} – \beta_{11} y_{t} – \beta_{12} z_{t} \\ x_{t} – \beta_{21} y_{t} – \beta_{22} z_{t} \end{bmatrix} = \alpha EC_t \end{align}\]3) r = 3 (full cointegration)
In the case of full cointegration, since all variables are stationary, the above VECM model reduces to a VAR model with level variables.
Johansen Test for Cointegration
The rank of \(\Pi\) equals the number of its non-zero eigenvalues and the Johansen test provides inference on this number. There are two tests for the number of co-integration relationships.
The first test is the trace test whose test statistic is
|
The second test is the maximum eigenvalue test whose test statistic is given by
|
In both cases, r denotes the number of cointegrations
For this Johansen cointegration test, we can use the ca.jo() function in the urca R package. The following R code shows how to use ca.jo() function with the typical input argument.
1 2 3 4 5 6 7 | vecm.model <– ca.jo( data_level, ecdet = “const”, type = “eigen”, K = 2, spec = “transitory”, season = 4, dumvar = NULL) summary(vecm.model) |
Relevant R functions
After running ca.jo() function for the cointegration test, there are three R functions for the estimation of VECM model.
These 3 R functions have the following functionalities.
|
By default, the ca.jo() function sets spec = “transitory”. This specification would mean that the error correction term refers to the first lag of the variables in levels as described above. By setting spec = “longrun”, the p−1th lag will be used instead. Further information on the interpretation the two alternatives can be found in the documentation of the urca R package.
ca.jo() will give you the estimated parameters for single or multiple long-run cointegrating relationships, but not other remaining parameters, which are obtained by the cajorls() function. Alternatively we can simply convert this ca.jo() result to the estimated VAR representation by using the vec2var() function in vars R package. The same results can be obtained by using VECM() function from the package tsDyn.
In summary, these R functions have the following relationships.
|
Here, lag of Δy + 1 = lag of y and r = # of cointegrating vectors.
Data
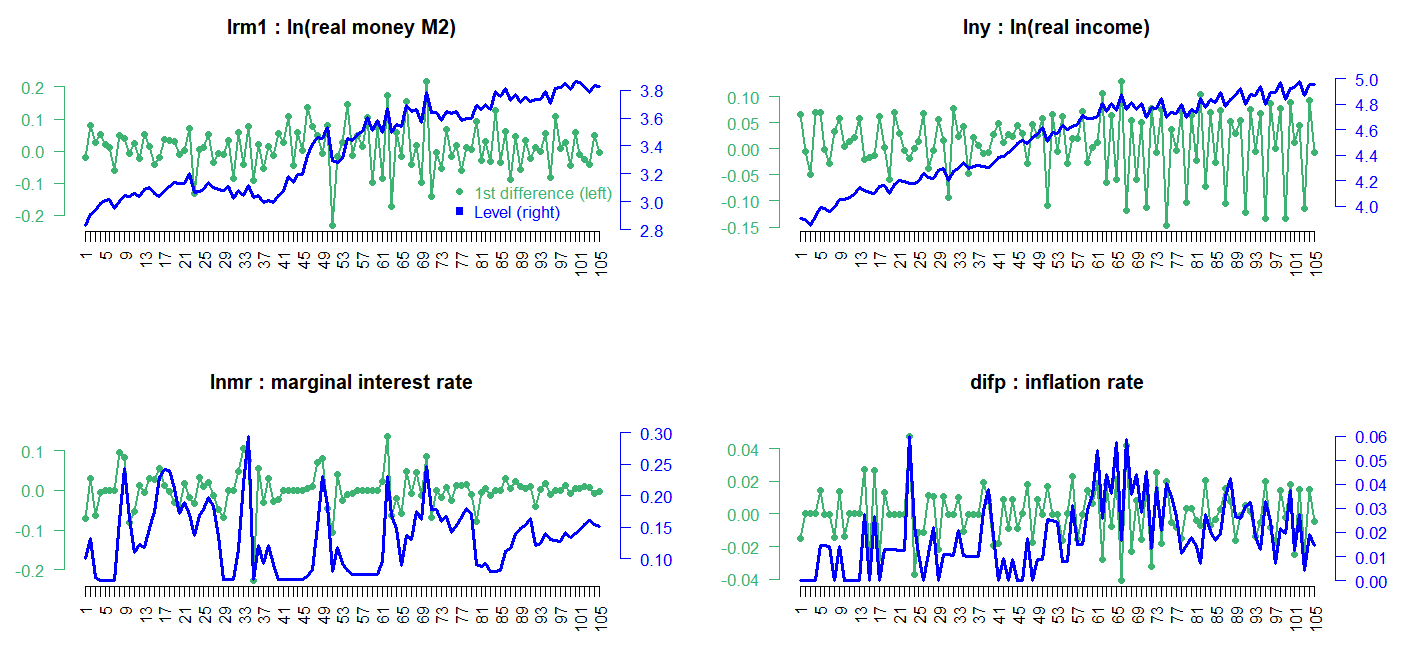
From urca R package, we can load finland dataset which is used for estimating a money demand function of Finland in Johansen and Juselius (1990). This dataset consists of logarithm of real money M2 (lrm1), logarithm of real income (lny), marginal interest rate (lnmr), inflation (difp), which covers the period 1958:Q1 – 1984:Q2.
Visual inspections of this data in level show that real income rises, there is a demand for more money to make the transactions. On the other hand, the negative relationship between money and interest rate is found since the interest one gives up is the opportunity cost of holding money. To be consistent with the estimated results of Johansen and Juselius (1990), we set VECM lag = 1 (VAR lag = 2) and the quarterly demeaned seasonal dummy variables and ecdet = “none” in ca.jo() function or LRinclude = “none” in VECM() function. For the Johansen cointegration test, we use maximum eigenvalue test (type = “eigen” in ca.jo() function)
R code
In the following R code, we set up VAR(p) model in levels and perform the Johansen cointegration test and estimate parameteres. With these estimated parameters, we forecast level variables.
#========================================================# # Quantitative ALM, Financial Econometrics & Derivatives # ML/DL using R, Python, Tensorflow by Sang-Heon Lee # # https://kiandlee.blogspot.com #——————————————————–# # Vector Error Correction Model and Cointegration #========================================================# graphics.off() # clear all graphs rm(list = ls()) # remove all files from your workspace library(urca) # ca.jo, ur.df, finland library(vars) # vec2var library(tsDyn) # VECM #======================================================== # Data #======================================================== # level data : 1958q1 – 1984q2 data(finland) lev <– finland; nr_lev <– nrow(lev) # the sample period yq <– expand.grid(1:4, 1958:1984)[1:nr_lev,] colnames(yq) <– c(“q”, “yyyy”); rownames(yq) <– NULL # quarterly centered dummy variables yq$Q1 <– (yq$q==1)–1/4 yq$Q2 <– (yq$q==2)–1/4 yq$Q3 <– (yq$q==3)–1/4 dum_season <– yq[,–c(1,2)] # 1st differenced data dif <– as.data.frame(diff(as.matrix(lev), lag = 1)) #======================================================== # Cointegration Test #======================================================== #———————————————- # Johansen Cointegration Procedure #———————————————- # ecdet = ‘none’ for no intercept # ‘const’ for constant term # ‘trend’ for trend variable # in cointegration # type = eigen or trace test # K = lag order of VAR # spec = “transitory” or “longrun” # season = centered seasonal dummy (4:quarterly) # dumvar = another dummy variables #———————————————- coint_ca.jo <– ca.jo( lev, ecdet = “none”, type = “eigen”, K = 2, spec = “transitory”, season = 4, dumvar = NULL) summary(coint_ca.jo) #======================================================== # VECM model estimation #======================================================== #———————————————— # VECM estimation #———————————————— # VECM(data, lag, r = 1, # include = c(“const”, “trend”, “none”, “both”), # beta = NULL, estim = c(“2OLS”, “ML”), # LRinclude = c(“none”, “const”,”trend”, “both”), # exogen = NULL) #———————————————— VECM_tsDyn <– VECM(lev, lag=1, r=2, estim = “ML”, LRinclude = “none”, exogen = dum_season) #———————————————— # restricted VECM -> input for r #———————————————— cajorls_ca.jo <– cajorls(coint_ca.jo, r=2) #———————————————— # the VAR representation of a VECM from ca.jo #———————————————— # vec2var: Transform a VECM to VAR in levels # ca.jo is transformed to a VAR in level # r : The cointegration rank #———————————————— vec2var_ca.jo <– vec2var(coint_ca.jo, r=2) #======================================================== # Estimation Results #======================================================== #———————————————- # parameter estimates from each model #———————————————- VECM_tsDyn cajorls_ca.jo vec2var_ca.jo #======================================================== # Forecast #======================================================== # forecasting horizon nhor <– 12 #———————————————- # Forecast from VECM() in tsDyn #———————————————- # quarterly centered dummy variables for forecast dumf_season <– rbind(tail(dum_season,4), tail(dum_season,4), tail(dum_season,4)) VECM_pred_tsDyn <– predict(VECM_tsDyn, exoPred = dumf_season, n.ahead=nhor) # Draw Graph x11(width=8, height = 8); par(mfrow=c(4,1), mar=c(2,2,2,2)) # historical data + forecast data df <– rbind(lev, VECM_pred_tsDyn) for(i in 1:4) { matplot(df[,i], type=c(“l”), col = c(“blue”), main = str.main[i]) abline(v=nr_lev, col=“blue”) } VECM_pred_tsDyn #———————————————- # Forecast from ca.jo() using vec2var() #———————————————- pred_vec2var_ca.jo <– predict(vec2var_ca.jo, n.ahead=nhor) x11(); par(mai=rep(0.4, 4)); plot(pred_vec2var_ca.jo) x11(); par(mai=rep(0.4, 4)); fanchart(pred_vec2var_ca.jo) m.pred_vec2var_ca.jo <– cbind( pred_vec2var_ca.jo$fcst$lrm1[,1], pred_vec2var_ca.jo$fcst$lny[,1], pred_vec2var_ca.jo$fcst$lnmr[,1], pred_vec2var_ca.jo$fcst$difp[,1]) colnames(m.pred_vec2var_ca.jo) <– colnames(lev) m.pred_vec2var_ca.jo #———————————————- # Comparison of two sets of forecast #———————————————- VECM_pred_tsDyn – m.pred_vec2var_ca.jo | cs |
Three models generate the same estimated parameters. Using these parameters we forecast the future values of the endogenous variables. However, cajorls() function can not be inserted into the predict() function. Therefore,
Results of Cointegration Test
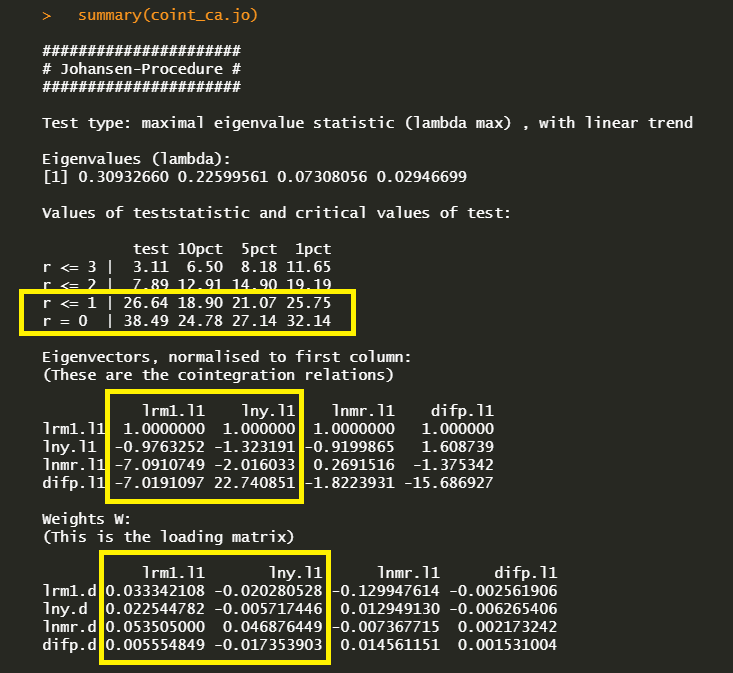
summary(coint_ca.jo) delivers the following maximum eigenvalue cointegration test results with \(\beta\) and \(\alpha\) estimates.
In the first r = 0 null hypothesis, since the test statistic 33.49 exceeds the 1, 5 and 10% critical values, there is at least one cointegration. In the second r = 1 null hypothesis, since the test statistic 26.64 also exceed the all critical values, the second hypothesis rejected. But in the third r = 3 null hypothesis, since the test statistic 7.89 does not exceed the all critical values, the third hypothesis can not be rejected. Therefore the cointegration is found at r = 2 under the maximum eigenvalue statistics.
Estimation Results
We estimate VECM parameters using three methods the following estimated results show the same output.
It seems that the following vec2var() output is different with the above two outputs. It’s because vec2var() estimate not a VECM in differences but a VAR in levels.
In particular, the first (VECM()) and second output(cajorls()) estimate beta coefficients with zero restrictions on some parameters. It is because of the fact that the eigenvector matrix is normalized using the Phillips triangular representation, which is used for identifying the relationships by using one zero restrictions (because we have two cointegrating relations r-1) in each relation. For this reason, we can see the shape of identity matrix from the upper position of estimated beta matrix.
Forecasting Results
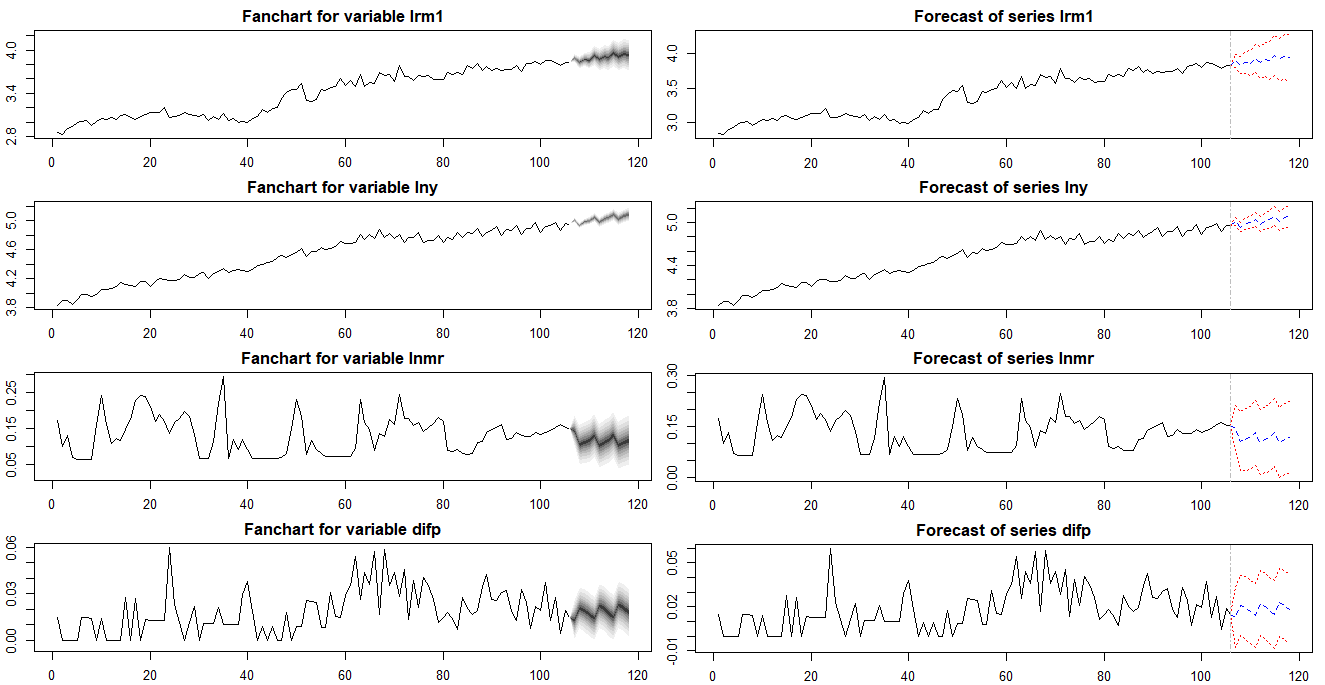
Unlike a vec2var() object with the ca.jo() output and VECM() object in tsDyn, cajorls() object is not linked to the prediction functionality. For this reason we need to perform a forecast of the VECM model by using the aforementioned two methods. Since forecast figures from two methods are same, we can use either one method.
The following figures is from the VECM() function in the tsDyn.
The following figure is from the vec2var() function in the vars with the ca.jo() result.
The differences between two forecast results are numerically zero at each point in forecasting horizon.
Concluding Remarks
In this post, we’ve implemented R code for the estimation of VECM model using several useful R package. The area of cointegration or VECM is so vast that it is difficult for me to understand it exactly. Nevertheless, I try to make clear explanations regarding some confusing parts in the VECM modeling. There are some interesting issues in this area such as the weak exogeneity restrictions or user defined cointegrating relationships based on some economic theory. This will be discussed later.
Reference
Johansen, S. and Juselius, K. (1990), Maximum Likelihood Estimation and Inference on Cointegration – with Applications to the Demand for Money, Oxford Bulletin of Economics and Statistics, 52, 2, 169–210. \(\blacksquare\)
To leave a comment for the author, please follow the link and comment on their blog: K & L Fintech Modeling.
R-bloggers.com offers daily e-mail updates about R news and tutorials about learning R and many other topics. Click here if you're looking to post or find an R/data-science job.
Want to share your content on R-bloggers? click here if you have a blog, or here if you don't.


