Analyzing player performance with animated charts!
Want to share your content on R-bloggers? click here if you have a blog, or here if you don't.
Analytics is by definition, the science (& art) of identifying, discovering and interpreting patterns in data. There are different ways of capturing these patterns through charts (bar, pie, cumulative data, moving average etc.). One such way is the motion or animated chart which captures the changes in data across different time periods. This was made famous by Hans Rosling in his Gapminder charts.
In this post, I use animated charts, based on gganimate(), to display the rise and fall of batsmen and bowlers in IPL and Intl. T20 (men). I only did this for these 2 formats as they have sufficient data over at least 10+ years.
To construct these animated charts, I use a ‘sliding window’ of 3 years, so that we get a clearer view of batsman and bowler consistency. The animated charts show the performance of players for this moving window for e.g. Jan 2008- Dec 2010, Jan 2009-Dec 2011, Jan 2010- Dec 2012 and so on till Jan 2019- Dec 2021. This is done for both batting( total runs) and bowling (total wickets). If you would like to analyse the performance of particular batsmen, bowler during specific periods or for a team vs another team or in the overall T20 format, check out my post GooglyPlusPlus2021: Towards more picturesque analytics!
You clone/fork the code from Github here animation
Included below are the animated charts.
Important note: The year which is displayed on the side actually represents the last 3 years, for e.g. 2015 (2013, 2014, 2015) or 2019 (2017, 2018, 2019)
- IPL Batting performance
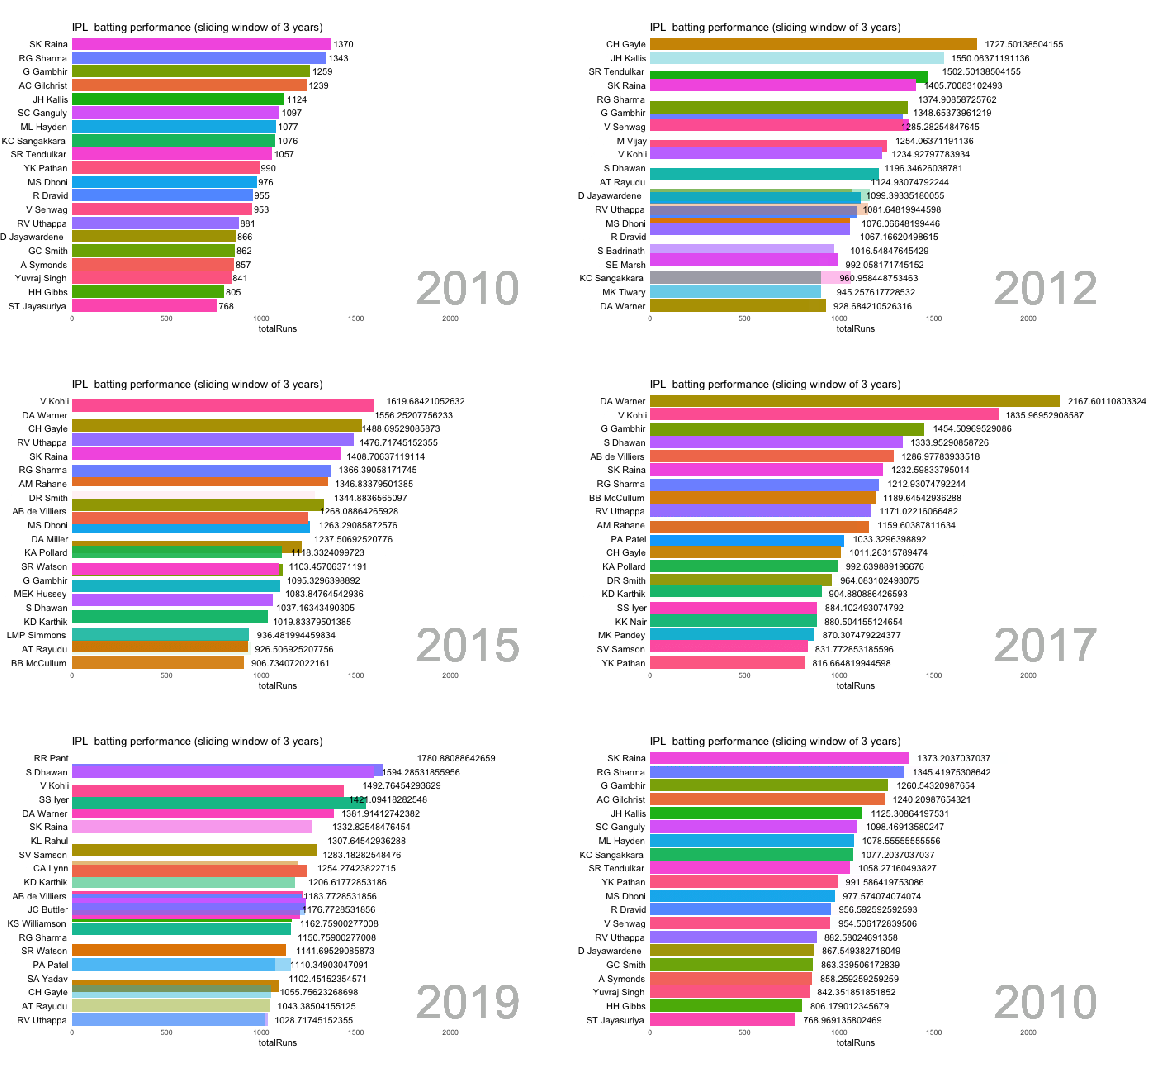
We can see that Kohli stays in the top 3 from 2015-2019
2. IPL Bowling performance

Malinga ruled from 2010- 2015. Bumrah is in top 3 from 2019-2021
3. IPL Batting in Power play

Adam Gilchrist, Tendulkar, Warner, KL Rahul, Shikhar Dhawan have a stay at the top
4. IPL Batting in Middle overs
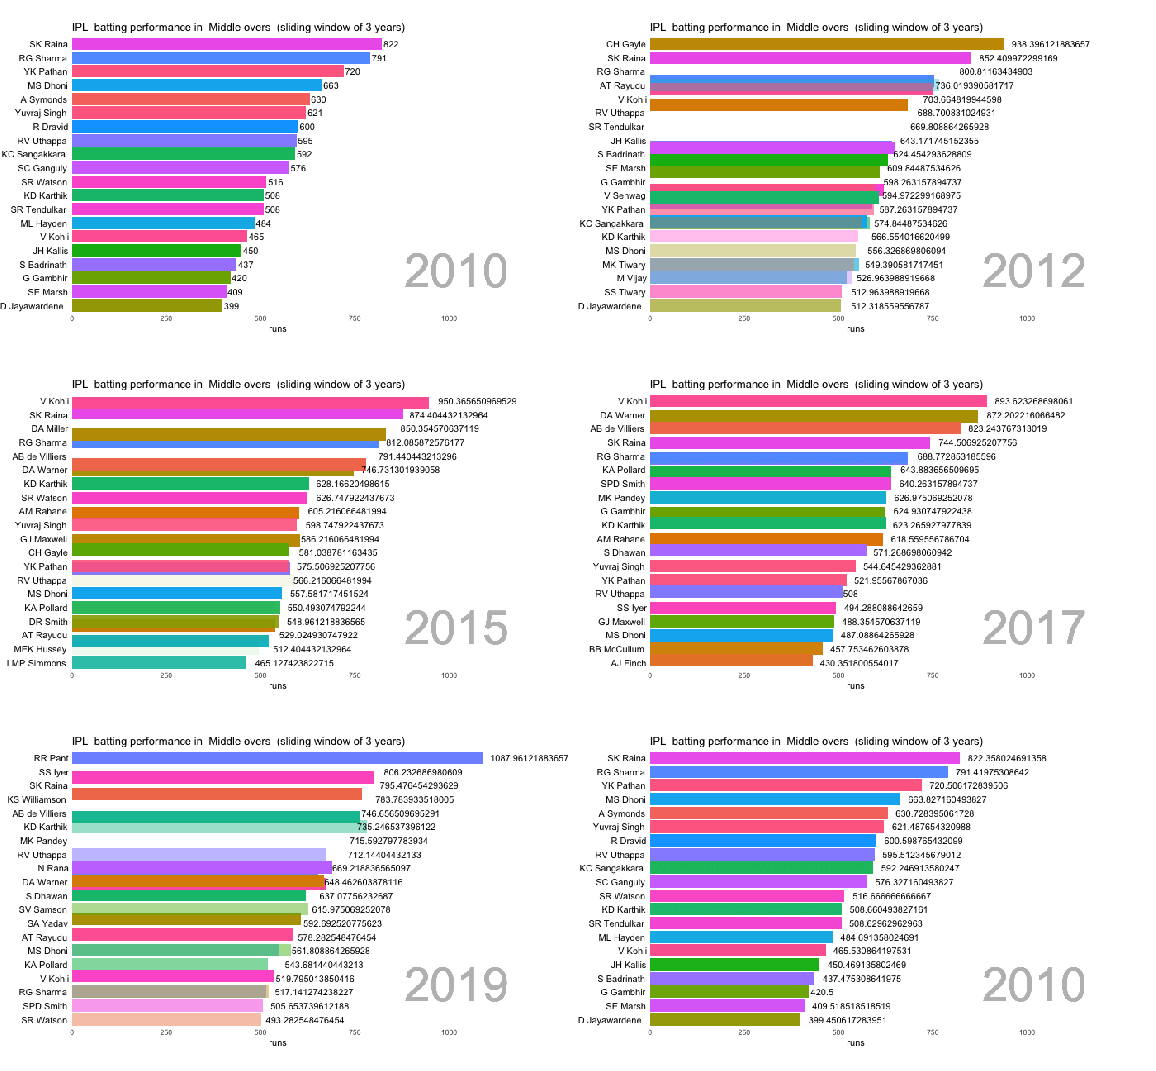
Rohit Sharma, Kohli, Pant have their stay at the top
5. IPL Batting Death overs
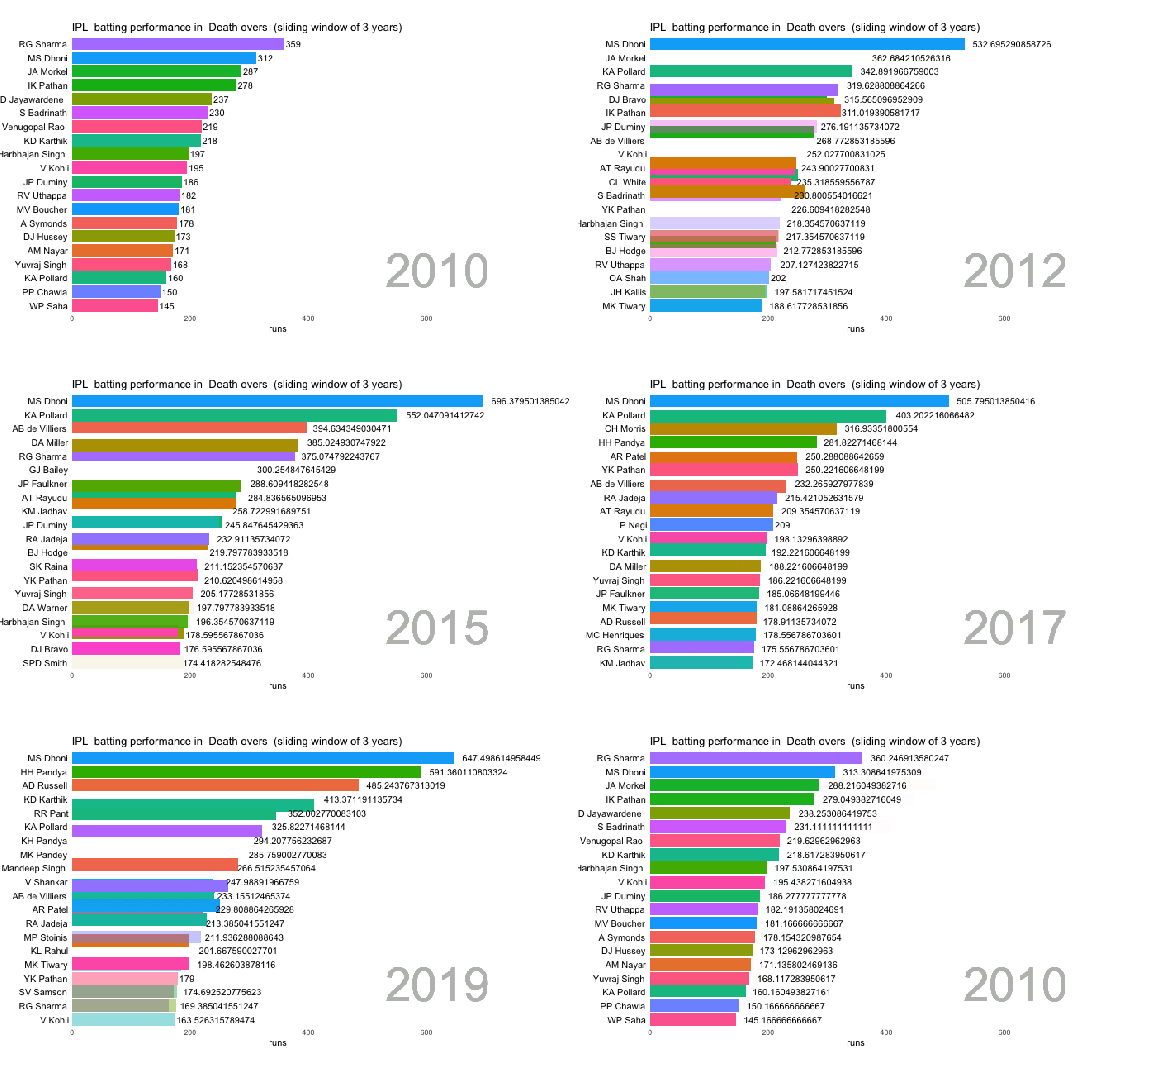
MS Dhoni is lord and master of the death overs in IPL for a rolling period of 10 years from 2011-2020. No wonder, he is the best finisher of T20 cricket
6. IPL Bowling Power Play
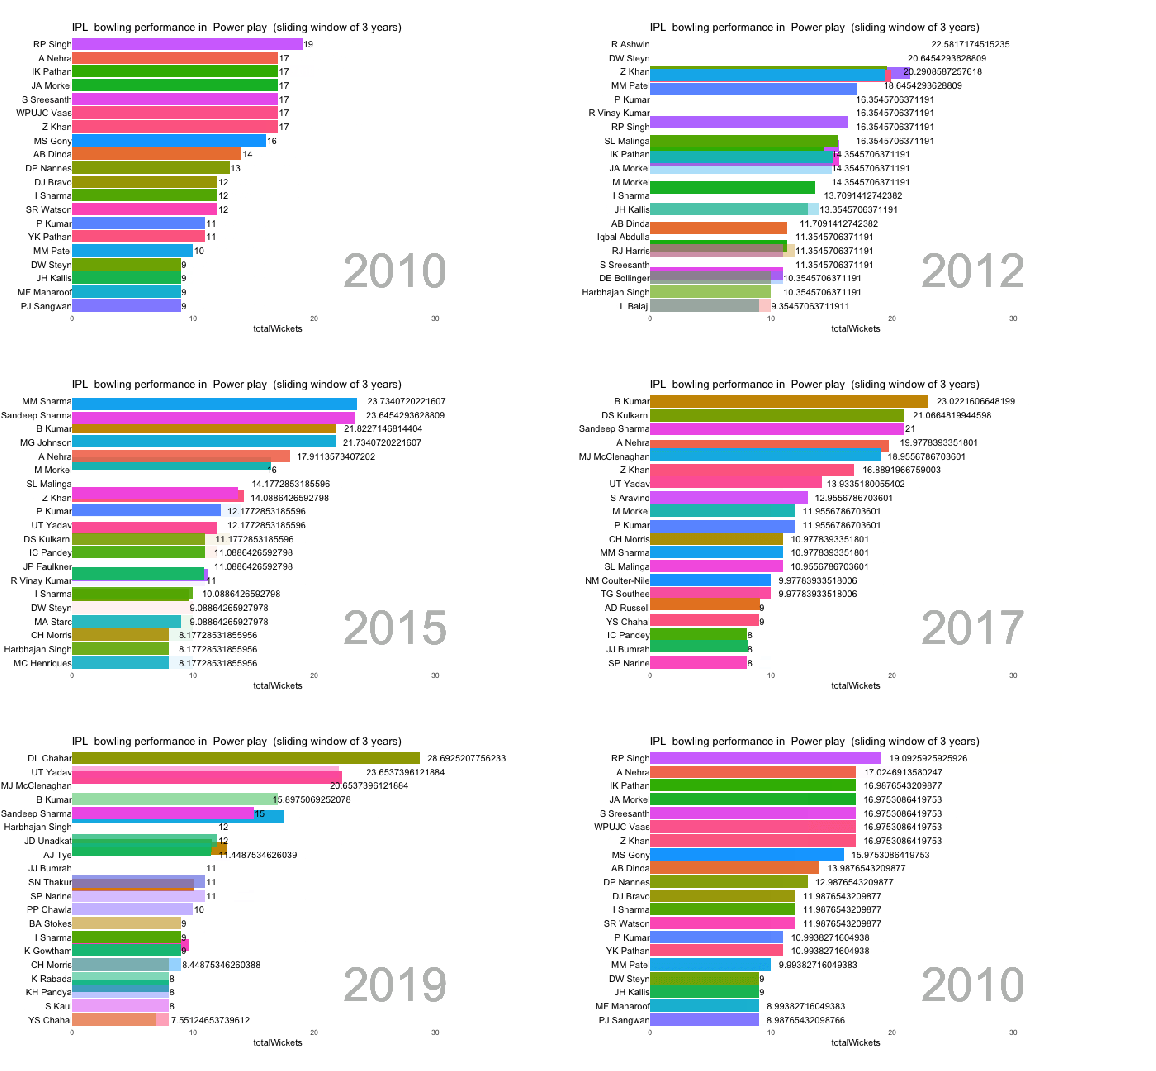
Bhuvanesh Kumar is in top 3 from 2014-2018 and then Deepak Chahar
7. IPL Bowling Middle overs

Toppers Harbhajan Singh, YS Chahal, Rashid Khan
8. IPL Bowling Death overs
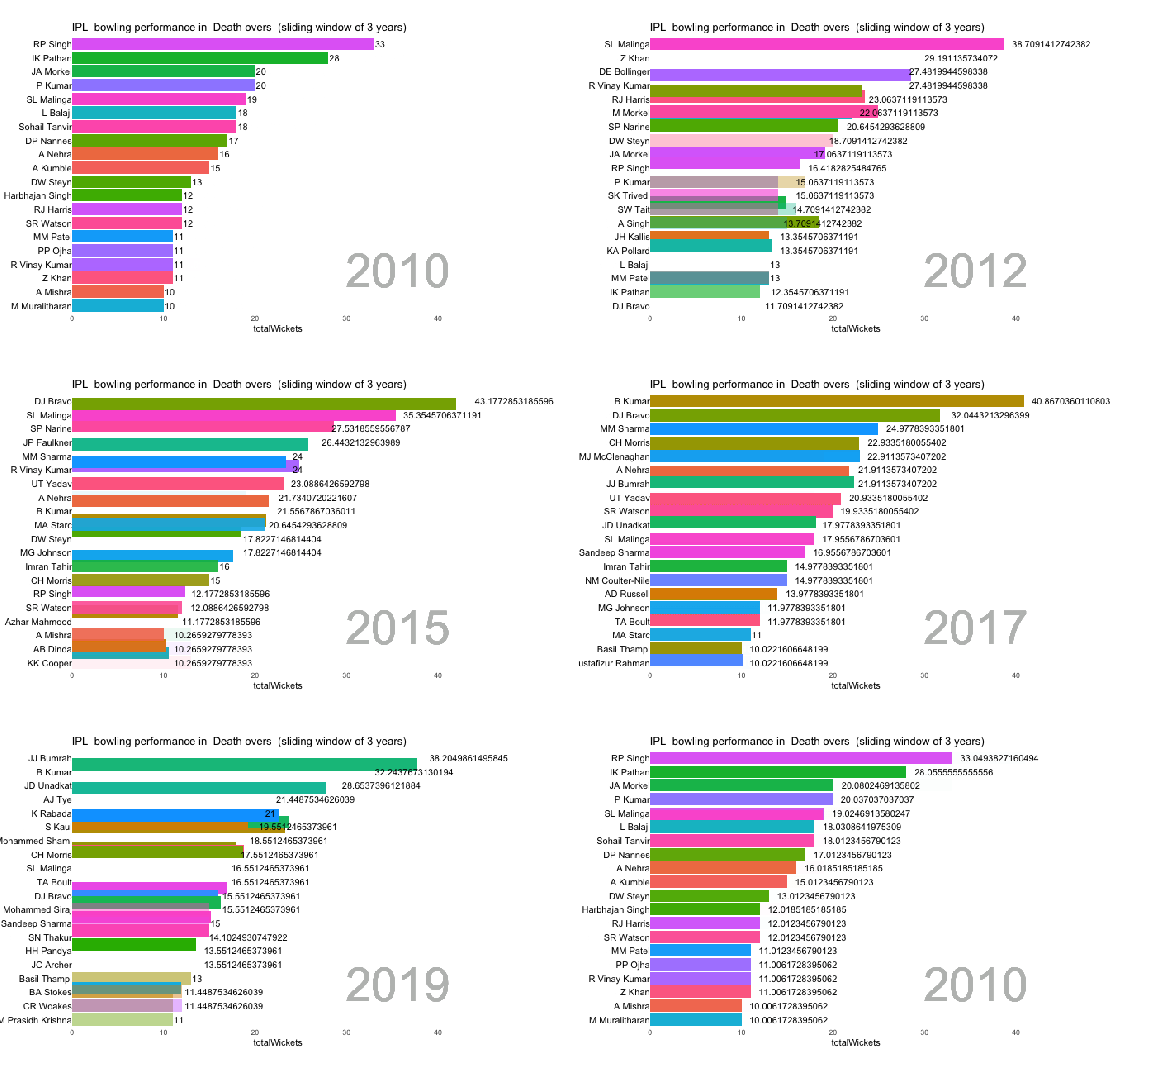
SL Malinga, B. Kumar, JJ Bumrah and Rabada top the list across the years
9. T20 (men) Batting performance
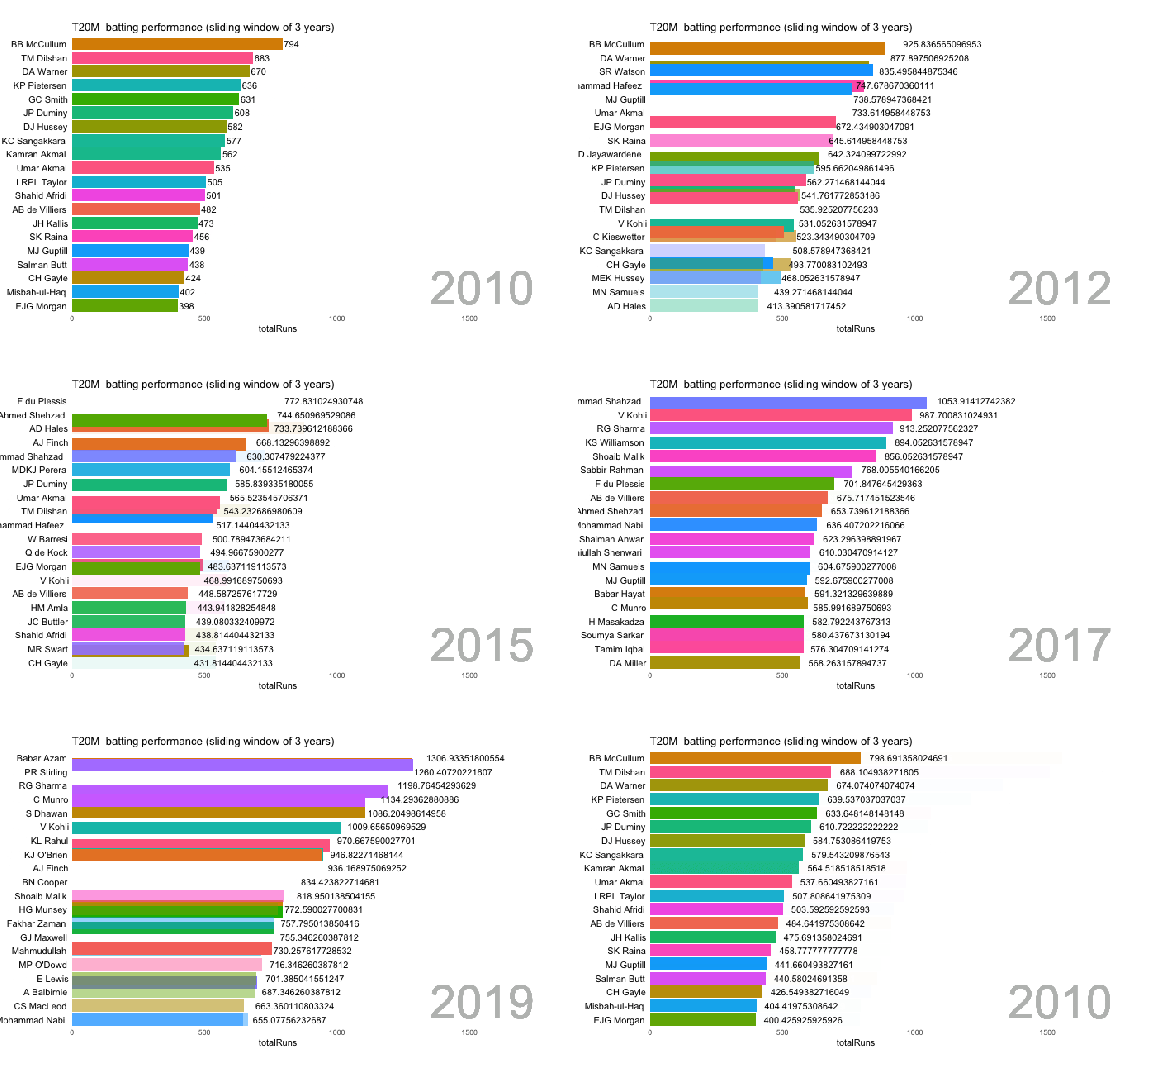
Kohli, Babar Azam, P R Stirling are best performers
10. T20 (men) bowling performance

Saaed Ajmal tops from 2010-2014 and Rashid Khan 2018-2020
11. T20 (men) batting Power play

Shahzad, D Warner, Rohit Sharma, PR Stirling best performers
12. T20 (men) batting middle overs
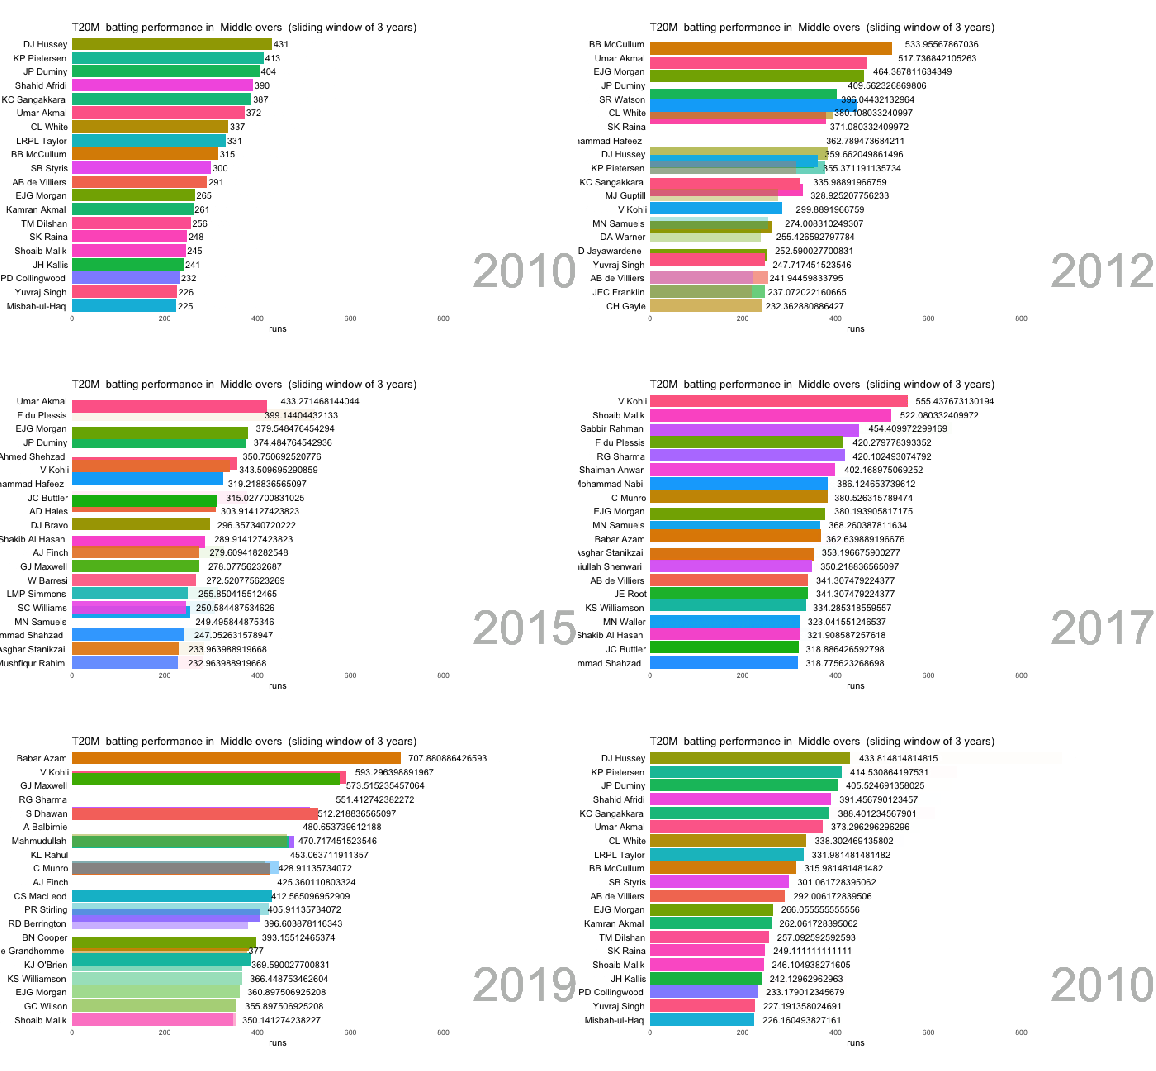
Babar Azam is the best middle overs player from 2018-2021
13. T20(men) batting death overs
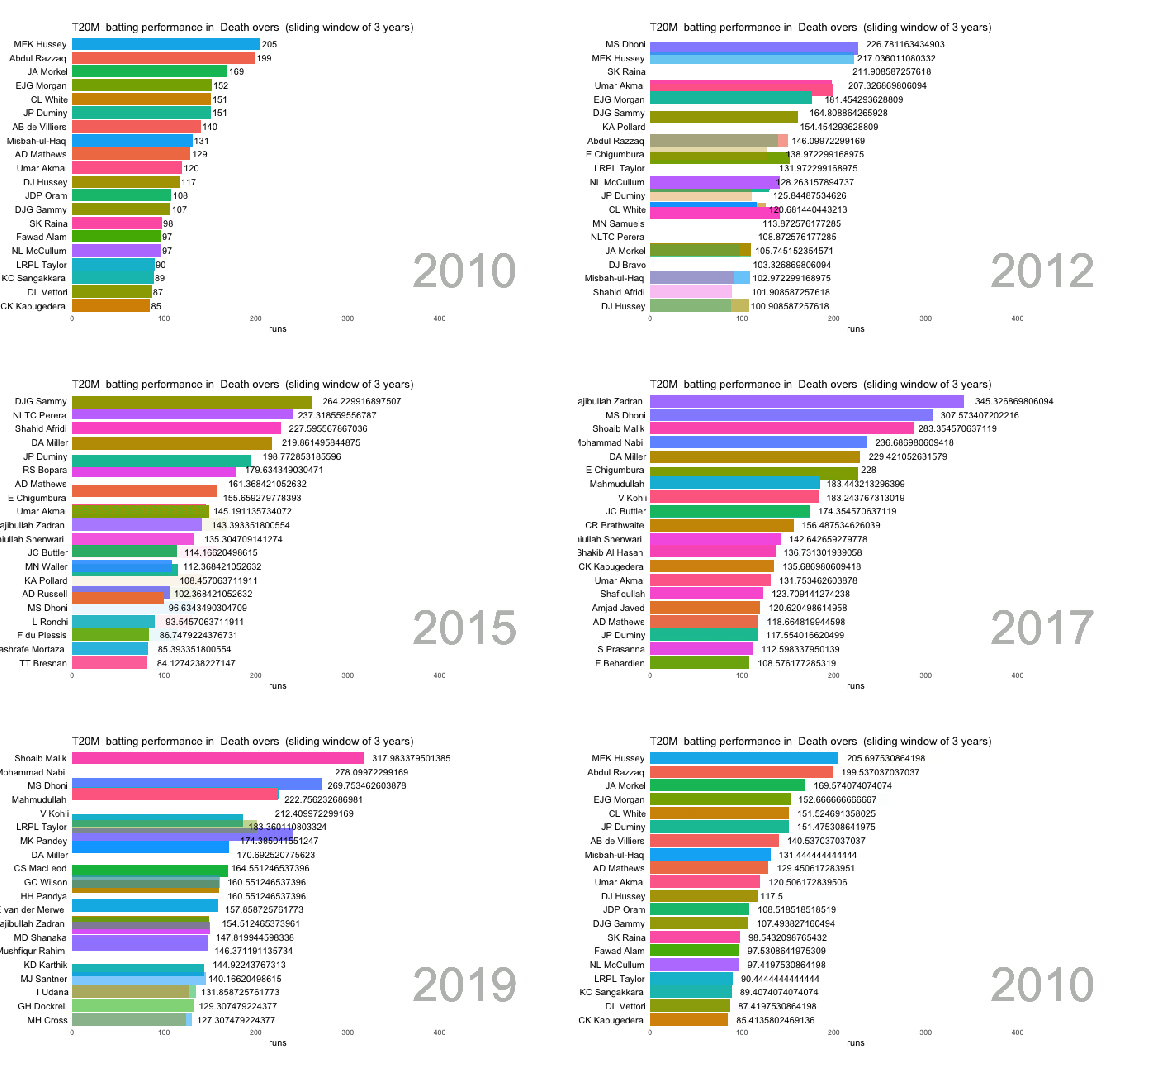
MS Dhoni, Shoaib Malik, V Kohli, David Miller are the best death over players
14. T20 (men) bowling Power play

Mohammad Nabi, Mujeeb ur Rahman, TG Southee are the best bowlers in power play
15. T20 (men) bowling middle overs
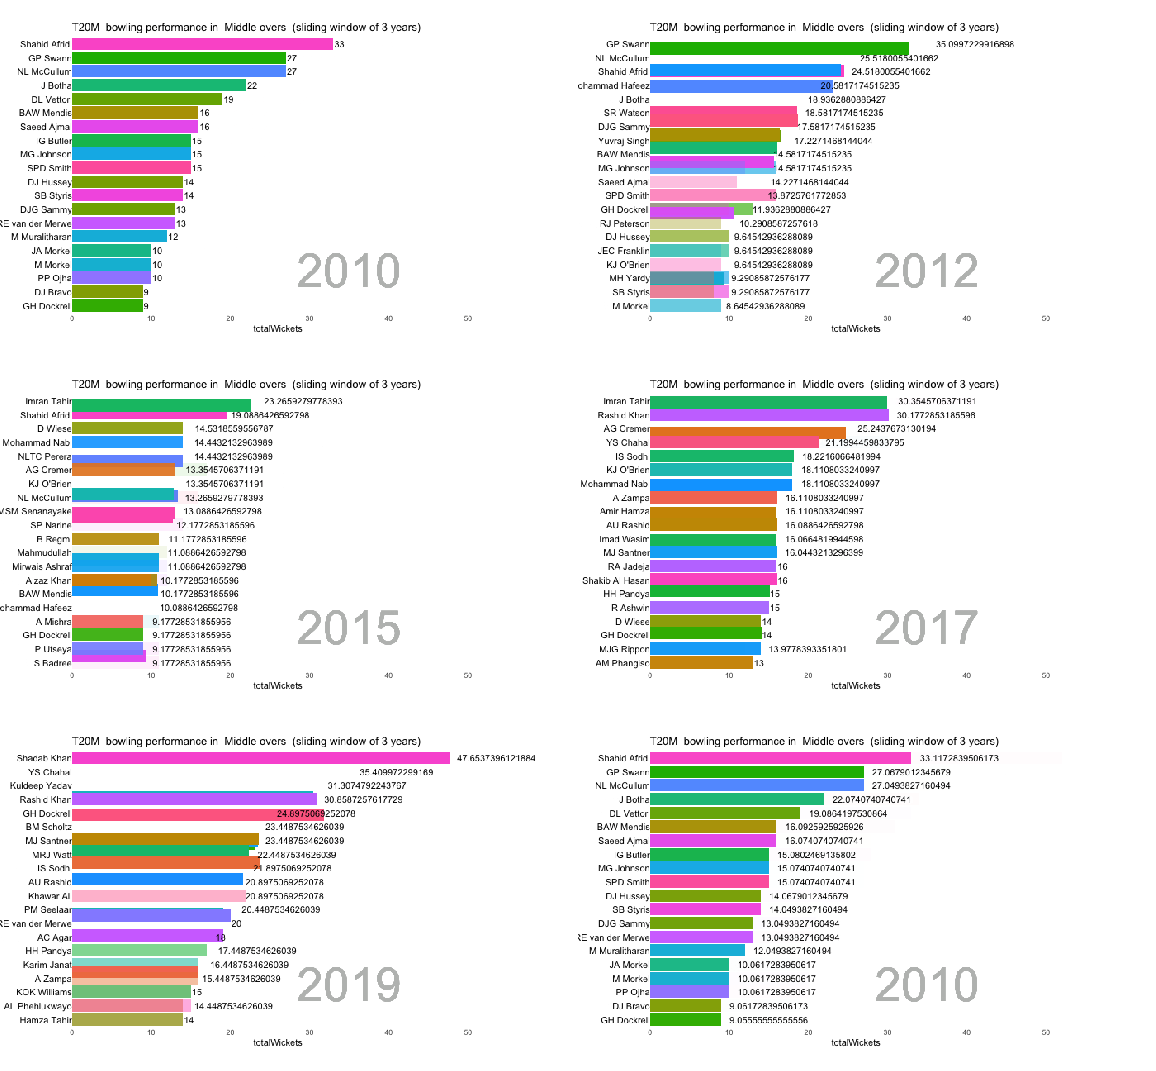
Imran Tahir from 2015-2017, Shadab Khan from 2018-2020, T Shamsi in 2021 top the tables
16. T20 (men) bowling death overs
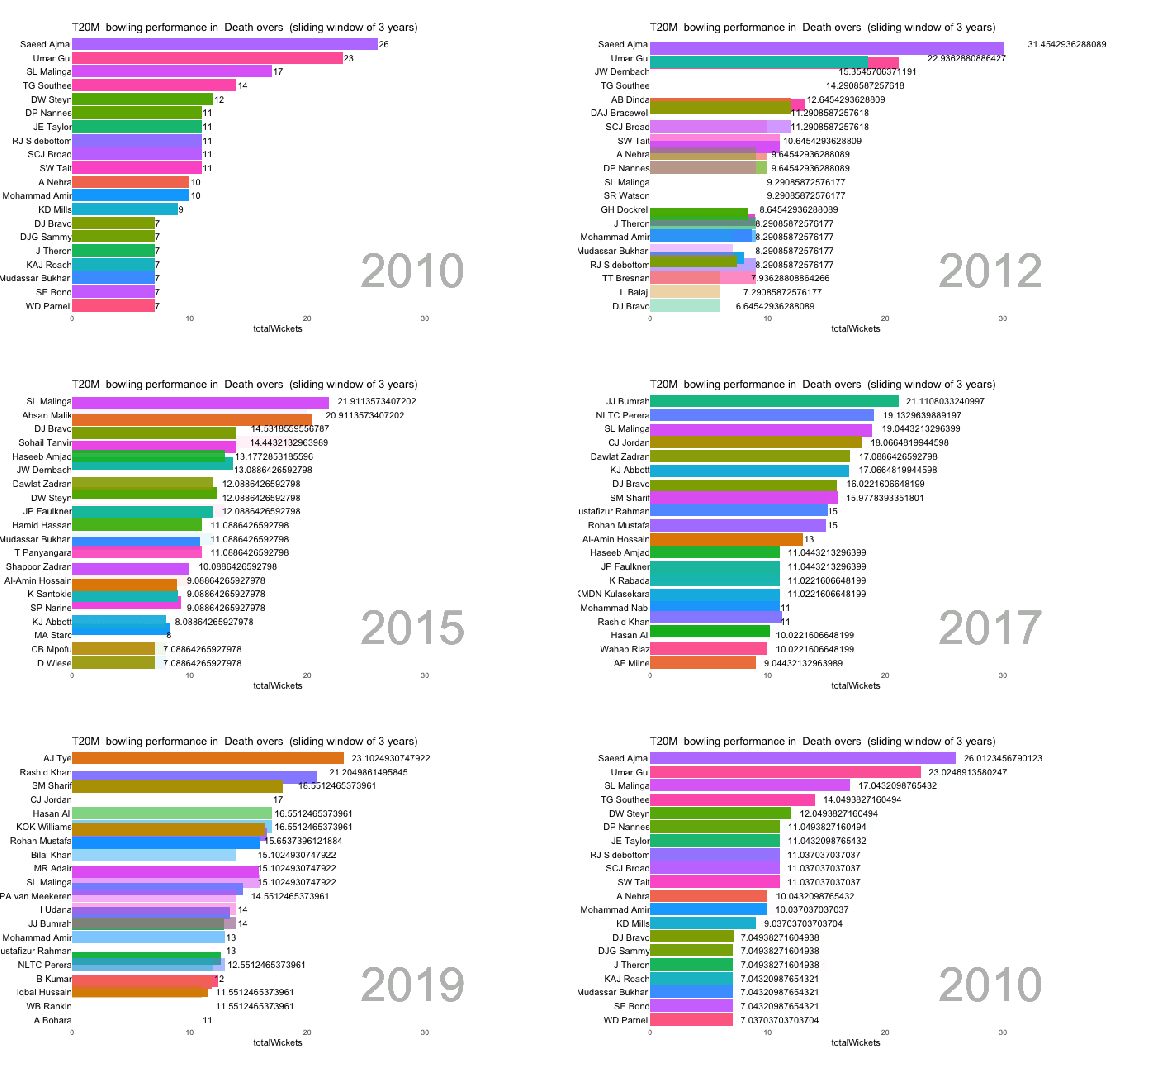
Saaed Ajmal, A J Tye, Bumrah, Haris Rauf occupy the top slot in different periods
Also see
- Experiments with deblurring using OpenCV
- Using Reinforcement Learning to solve Gridworld
- Deep Learning from first principles in Python, R and Octave – Part 8
- Big Data-4: Webserver log analysis with RDDs, Pyspark, SparkR and SparklyR
- The Anomaly
- Practical Machine Learning with R and Python – Part 3
- Using Linear Programming (LP) for optimizing bowling change or batting lineup in T20 cricket
- Introducing cricpy:A python package to analyze performances of cricketers
To see all posts click Index of posts
R-bloggers.com offers daily e-mail updates about R news and tutorials about learning R and many other topics. Click here if you're looking to post or find an R/data-science job.
Want to share your content on R-bloggers? click here if you have a blog, or here if you don't.
