
Package modEvA 3.0 is now on CRAN!
Want to share your content on R-bloggers? click here if you have a blog, or here if you don't.
This version of R package “model Evaluation and Analysis” includes some bug fixes (thanks to Huijie Qiao, Ying-Ju Tessa Chen, Oswald van Ginkel and Alba Estrada), some new functions (predPlot, confusionLabel, and mod2obspred, which is now used internally by several others), and it implements more classes (‘gam’, ‘gbm’, ‘randomForest’, ‘bart’) besides ‘glm’ for the ‘model‘ argument in most functions. There are also a few argument additions and improvements — e.g., varPart now has an option to plot the circles in colour (thanks to Oswald van Ginkel). You can read the package NEWS file for details.
You can now install the newest version of modEvA from CRAN and try out some of these new features:
install.packages("modEvA")library(modEvA)
# load some other packages to make different models:library(gam)
library(gbm)
# take a sample dataset and create a numeric binary response variable:data(kyphosis)
head(kyphosis)
kyphosis$Kyphosis <- ifelse(kyphosis$Kyphosis == "present", 1, 0)
# make different models with this response variable:mod_glm <- glm(Kyphosis ~ Age + Number + Start, family = binomial, data = kyphosis)
mod_gam <- gam(Kyphosis ~ s(Age) + s(Number) + s(Start), family = binomial, data = kyphosis)
mod_gbm <- gbm(Kyphosis ~ Age + Number + Start, distribution = "bernoulli", data = kyphosis)
# get different evaluation metrics/plots directly from the model objects:
# e.g., density of predictions for presences and absences:predPlot(model = mod_glm, main = "GLM")
predPlot(model = mod_gam, main = "GAM")
predPlot(model = mod_gbm, main = "GBM")
predDensity(model = mod_glm, main = "GLM")
predDensity(model = mod_gam, main = "GAM")
predDensity(model = mod_gbm, main = "GBM")

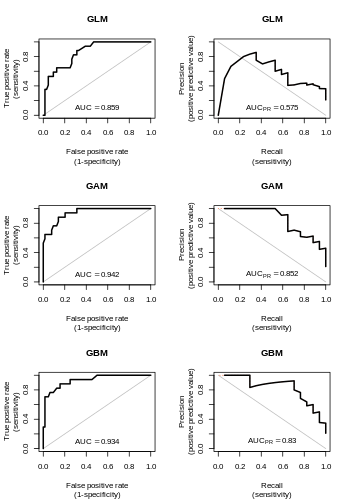
# (area under the) ROC and Precision-Recall curves:
AUC(model = mod_glm, main = "GLM")
AUC(model = mod_gam, main = "GAM")
AUC(model = mod_gbm, main = "GBM")
AUC(model = mod_glm, curve = "PR", main = "GLM")
AUC(model = mod_gam, curve = "PR", main = "GAM")
AUC(model = mod_gbm, curve = "PR", main = "GBM")
You can try also other functions such as ‘threshMeasures‘, ‘MillerCalib‘ or ‘HLfit‘. And check out the colour version of ‘varPart‘:
varPart(A = 0.456, B = 0.315, AB = 0.852, A.name = "Spatial", B.name = "Climatic", col = TRUE)varPart(A = 0.456, B = 0.315, C = 0.281, AB = 0.051, BC = 0.444,
AC = 0.569, ABC = 0.624, A.name = "Spatial", B.name = "Human",
C.name = "Climatic", col = TRUE)

Feel free to send me any bug reports! Feature requests/suggestions are also welcome, though I can’t promise a timely response… And remember to look for the latest package updates in the development page on R-Forge!
R-bloggers.com offers daily e-mail updates about R news and tutorials about learning R and many other topics. Click here if you're looking to post or find an R/data-science job.
Want to share your content on R-bloggers? click here if you have a blog, or here if you don't.