It Has Always Been Wrong to Call order on a data.frame
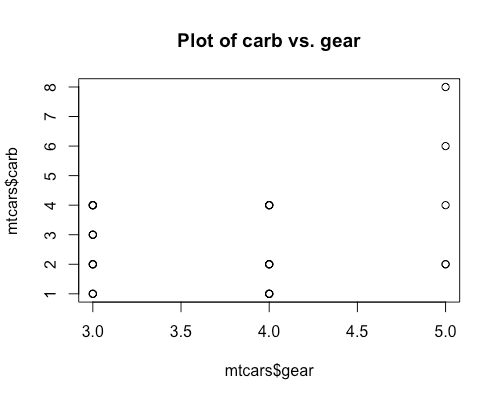
In R it has always been incorrect to call order() on a data.frame. Such a call doesn’t return a sort-order of the rows, and previously did not return an error. For example. d [Read more...]


Copyright © 2022 | MH Corporate basic by MH Themes