January 2021
The workhorse of Machine Learning is Gradient Descent. If you want to understand how and why it works and, along the way, want to learn how to plot and animate 3D-functions in R read on! Gradient Descent is a mathematical algorithm to optimize functions, i.e. finding their minima or ... [Read more...]
How to Make 3D Plots in R
This article is part of a R-Tips Weekly, a weekly video tutorial that shows you step-by-step how to do common R coding tasks.
The RStudio IDE is amazing. You can enhance your R productivity even more with these simple keyboard shortcuts.
Here are t...

lmDiallel: a new R package to fit diallel models. The Griffing’s models (1956)
Diallel mating designs are often used by plant breeders to compare the possible crosses between a set of genotypes. In spite of such widespread usage, the process of data analysis in R is not yet strightforward and it is not clear which tool should ... [Read more...]
Topographic Maps for South Africa
I’ve been adding topological maps of South Africa to the saffer-data-map repository. The maps are originally in MrSID format (.sid files), which is a proprietary file format developed by LizardTech (a company which has been consumed by Extensis).
Although MrSID is efficient from a storage perspective, it’s challenging ...

Who’s Missing?
Motivation
Preparation
Tools and Libraries
Python Function
Demo
Data
Application
What Did We Improve?
Finding out what’s missing in the data is one of those grinding data wrangling tasks of data science. Though they are missing data, if not pointed out and handled properly they can come back and ... [Read more...]
lmDiallel: a new R package to fit diallel models. The Griffing’s models (1956)
Diallel mating designs are often used by plant breeders to compare the possible crosses between a set of genotypes. In spite of such widespread usage, the process of data analysis in R is not yet strightforward and it is not clear which tool should be ... [Read more...]
YouTube Channel Update: Coffee Ratings Analysis now up!
I decided to do something new on my Youtube Channel by putting my latest blog post on analyzing the Coffee Ratings dataset from the Tidy Tuesday project into video form. This video does mostly skip over the R code I used and focuses more on the actual analysis I did. ... [Read more...]
GAMs and scams: Part 1
People who do statistical modeling for insurance applications usually know their way around a GLM pretty well. In pricing applications, GLMs can produce a reasonable model to serve as the basis of a rating plan, but in my experience they are usually followed by a round of “selections” – a process ...

Upcoming Why R Webinar – Why using R for analysis of the human microbiome is a good idea
On Thursday, January 14th at 7 pm UTC, as part of the Why R? Webinar series, we have the honour to host
Susan Holmes from Stanford University. She will talk about microbiomes and
how to use R’s workflow to perform sophisticated downstream statistica... [Read more...]
Little useless-useful R functions – Countdown number puzzle
The famous countdown game loved among mathematicians and people adoring numbers and why not find a way to check for solutions. So the game is (was) known as a TV show where then host would give a random 3-digit number…Read more ›

Simulating the dice game “Toss Up!” in R
Toss Up! is a very simple dice game that I’ve always wanted to simulate but never got around to doing so (until now!). This post outlines how to simulate a Toss Up! game in R, as well as how to … Continue reading →

X-Sessions at rstudio::global
Photo by Jeffery Ho on Unsplash
When you registered for rstudio::global(2021), you might have noticed a question asking if you were interested in participating in any hands-on sponsored sessions prior to the conference. To kick off rstudio::global, som... [Read more...]
Wonderful Wednesdays
For almost a year now, the PSI Visualization Special Interest Group (VIS SIG) has been conducting a monthly graduate-level seminar on creating effective statistical visualizations that is open to everyone. Wonderful Wednesdays is a unique collegial event. Every month the SIG publishes a link to a new data set and ...

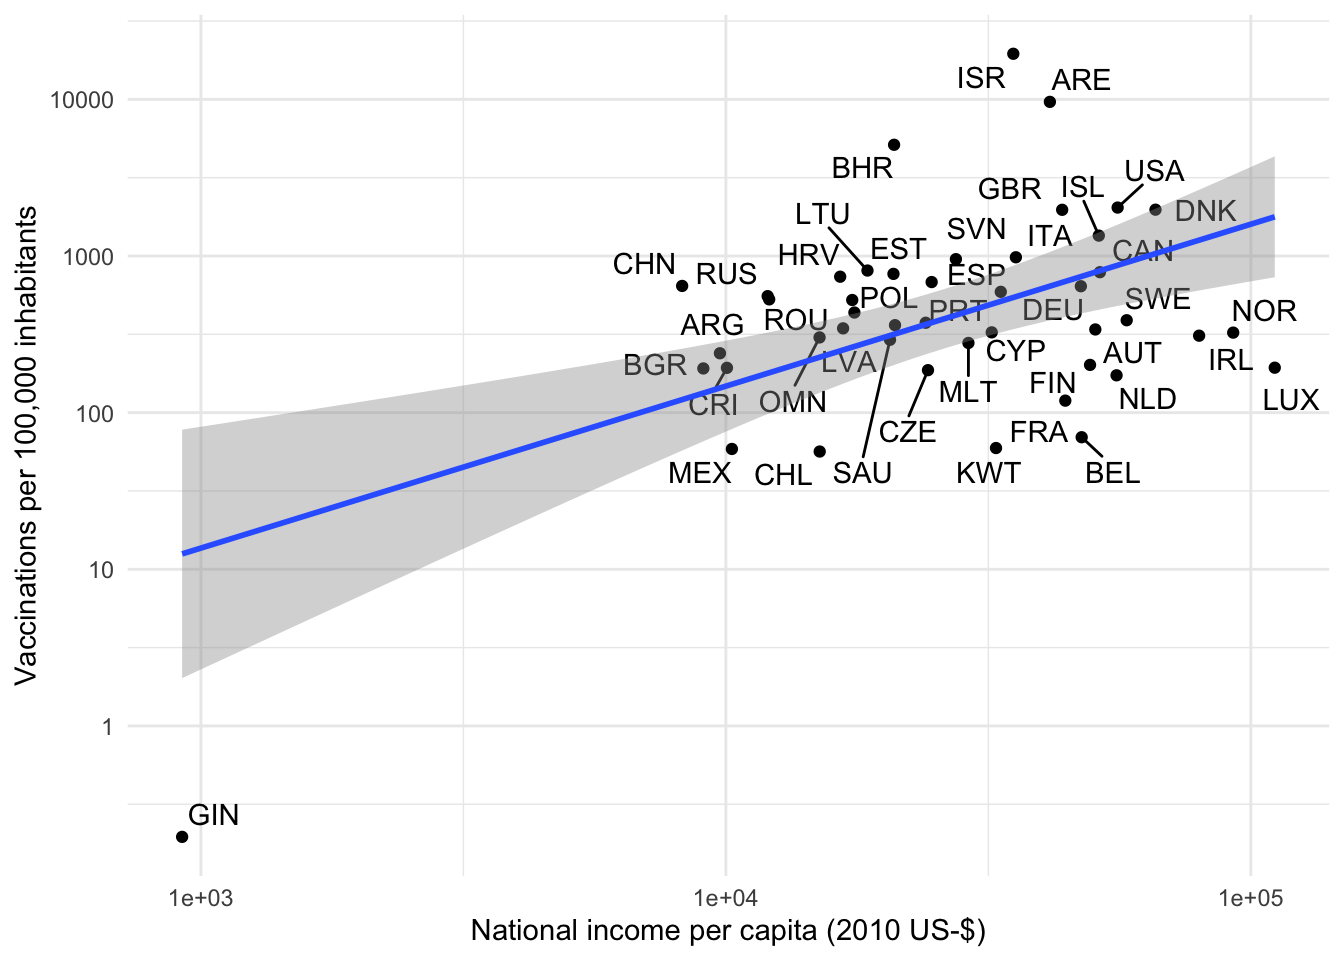
Vaccination Data: An Outlier Tale
I recently included the new Our World in Data data on Covid-19 hospitalizations and the vaccination progress around the world in the {tidycovid19} package. What was meant to be a short info post for package users turned into a mini case on “outlie...

Fantasy Football and the Classical Scheduling Problem
Introduction
Every year I play in several fantasy football (American) leagues. For those who are unaware, it’s a game that occurs every year in sync with the National Football League (NFL) where participants play in weekly head-to-head games a...

Explaining predictions of Convolutional Neural Networks with ‘sauron’ package.
Explainable Artificial Intelligence, or XAI for short, is a set of tools that helps us understand and interpret complicated “black box” machine and deep learning models and their predictions. In my previous post I showed you a sneak peek of my newest p...

Price of Fuel in South Africa
The {saffer} package is a nascent collection of things relating to South Africa. I’ve just added fuel price data.
The {saffer} package can be installed from GitHub.
remotes::install_github("datawookie/saffer")
Then load it up and you’re ...

Chi-square tests
Chi-square test is a statistical method used for analysis of categorical data. There are 2 types:
1. Goodness of fit
Known as: * Chi-square for 1 sample
* Chi-square for given proportions
Purpose : Comparing the observed frequency to the expected... [Read more...]
Empirical Economics with R (Part A): The wine formula and machine learning
This semester I teach a new course: Empirical Economics with R. All material is online available, including video lectures with quizzes and interactive RTutor problem sets, which are perhaps the most important part of the course.
One goal when designing the course was to motivate most concepts with one or ... [Read more...]
Copyright © 2022 | MH Corporate basic by MH Themes