SwimmeR version 0.7.2 is now available from CRAN. This new version contains some new features, plus a few changes to make it more user-friendly. Let me show you what I’ve been working on.
library(SwimmeR)
library(dplyr)
library(stringr)
library(flextable)
library(rbenchmark)

flextable_style <- function(x) {
  x %>%
    flextable() %>%
    bold(part = "header") %>% # bold header
    bg(bg = "#D3D3D3", part = "header") %>% # puts gray background behind the header row
    align_nottext_col(align = "center", header = TRUE, footer = TRUE) %>% # center alignment
    autofit()
}
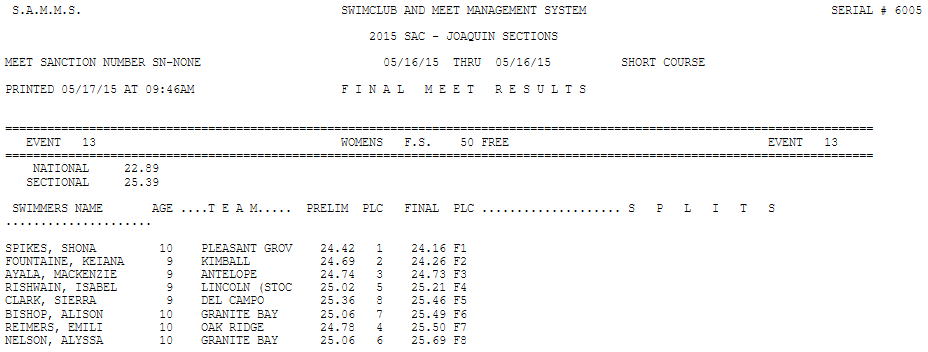
New Features
SwimmeR can now parse S.A.M.M.S. style results. S.A.M....