August 2020

How to subset a data frame column data in R

August 18, 2020 | dataenq.

In this article, we present the audience with different ways of subsetting data from a data frame column using base R and dplyr. Let’s check out how to subset a data frame column data in R. The summary of the content of this article is as follows: Data Reading ... [Read more...]

How to prepare data for analysis in r

August 18, 2020 | dataenq.

Welcome to our first article. This article aims to bestow the audience with commands that R offers to prepare the data for analysis in R. Why prepare data? If you are lucky, you may not have to prepare data, though real-life data has gaps, errors, missing values, etc. The quality ... [Read more...]

Introduction to ggplot2

August 17, 2020 |

TL:DR: If you are new to ggplot, welcome! If you are used to base R, its probably going to take awhile for you to get the hang of the syntax, but trust me, it’s worth it. GGplot is the tidyverse package for making graphics and you can control ...
[Read more...]

Generating data from a truncated distribution

August 17, 2020 | Keith Goldfeld

A researcher reached out to me the other day to see if the simstudy package provides a quick and easy way to generate data from a truncated distribution. Other than the noZeroPoisson distribution option (which is a very specific truncated distribution), there is no way to do this directly. You ...
[Read more...]

Developing dittodb

August 17, 2020 | rOpenSci - open tools for open science

This post describes a few different aspects behind the scenes of the development of dittodb which recently went through the rOpenSci peer review process and was released to CRAN on 24 July 2020. This isn’t an introduction to the package itself (that’s available on dittodb’s site), but rather a ... [Read more...]

Predicting pneumonia outcomes: Feature Engineering

August 17, 2020 | R on notast

Intro This post is a supplementary material for an assignment. The assignment is part of the Augmented Machine Learning unit for a Specialised Diploma in Data Science for Business. The aim of the assignment is to use DataRobot for predictive modelling. Exploratory data analysis and feature engineering will be done ...
[Read more...]

How to create an API for your R code

August 17, 2020 | Andrew Treadway

In the video linked below we discuss how to convert your R code into an API using the awesome plumber package! Learn more by clicking here or by following the links below. The plumber package allows you to convert R functions into API calls. For example, rather than launching R ...
[Read more...]

Unrolling the ROC

August 17, 2020 | nzumel

In our data science teaching, we present the ROC plot (and the area under the curve of the plot, or AUC) as a useful tool for evaluating score-based classifier models, as well as for comparing multiple such models. The ROC is informative and useful, but it’s also perhaps overly ...
[Read more...]

Accuracy of forecasting methods: Can you tell the difference?

August 17, 2020 | Ivan Svetunkov

Previously we discussed how to measure accuracy of point forecasts and performance of prediction intervals in different cases. Now we look into the question how to tell the difference between competing forecasting approaches. Let’s imagine the situation, when we have four forecasting methods applied to 100 time series with accuracy ...
[Read more...]

Why Data Doesn’t Have to Be That Big

August 17, 2020 | Joyce Chiu

Defining big data Big data is one of the buzziest words in the data space. But just how big is big? One way to think about it is in terms of volume, or the amount of data you have. Based on volume, we can define big data as data that ...
[Read more...]

Parallel R in a nutshell

August 17, 2020 | Pablo Rodríguez-Sánchez

Photo by Marvin Meyer on UnsplashLoops are, by definition, repetitive tasks. Although it is not part of the definition, loops also tend to be boring. Luckily for us, computers are good at performing repetitive tasks, and they never complain about boredom.When the tasks are complex, or if the number ...
[Read more...]

Labor Force Growth by Decade – R Code

August 16, 2020 | Franklin Parker

I just posted an interesting look at the growth of the labor force by decade. Given that I used R to produce it, I thought it interesting to share the R code and method. Just for reference, here is the chart: First, we will need the following libraries The quantmod ...
[Read more...]

tinieR 0.1.0

August 16, 2020 | » R

TLDR: I wrote an R package. You can find it here: tinieR - An R package to shrink image filesizes with TinyPNG.com I learnt R about a year ago to do the statistical testing for my dissertation. While borne of neccessity, it ended up kickstarting a w... [Read more...]

Creative commons in the meantime

August 15, 2020 | Guillaume Pressiat

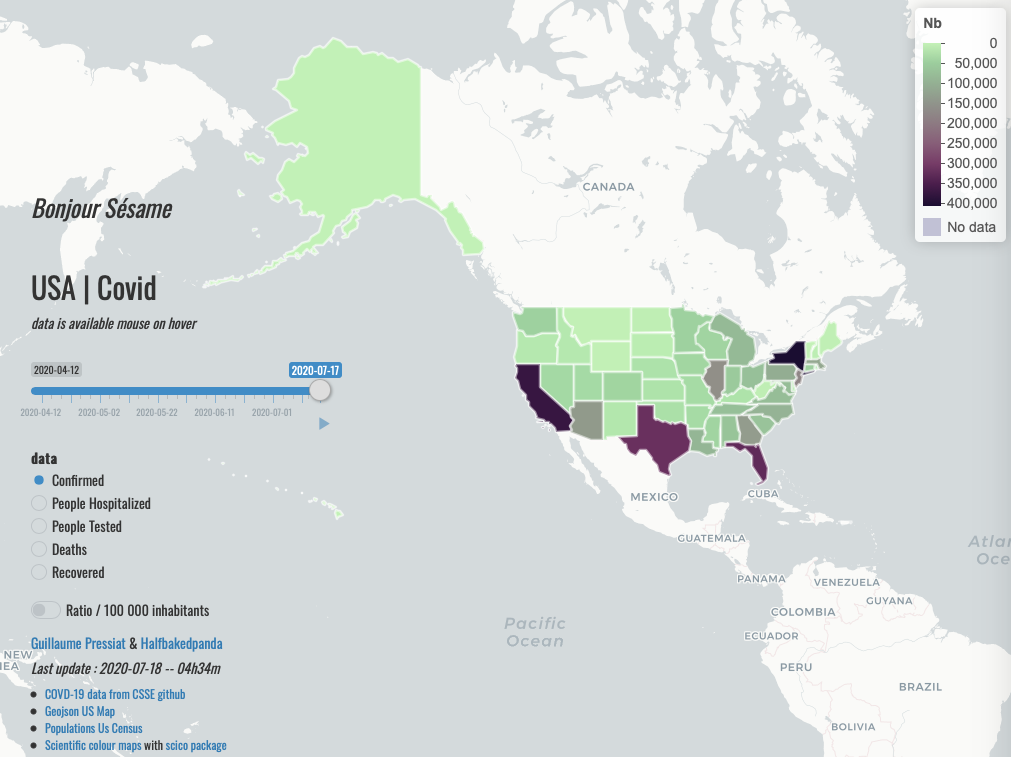
Just a little post about sharing code and skills with the unknown. After posting about covidfrance app, I exchanged with github users wanting to reproduce the app for their country.. I just want to say here that it was really a pleasure to exchan...
[Read more...]
1 4 5 6 7 8 12

Never miss an update!
Subscribe to R-bloggers to receive
e-mails with the latest R posts.
(You will not see this message again.)

Click here to close (This popup will not appear again)