
RvsPython #2: Pivoting Data From Long to Wide Form
Want to share your content on R-bloggers? click here if you have a blog, or here if you don't.
Note: This is an older post originally written as a LinkedIn article I wrote in late May. I have added information about shaping data thanks to Casper Crause using the data.table library. You can see our original correspondence in the comments there (for now)
If you dabble in data, you know one of the challenges that everyone has when working with data is reshaping data to the form you want to use it; thankfully, there are ways to shape data in both Python and R to speed up the process by using some of the functions available in their extensive libraries.
In this post, we will be looking at how to pivot data from long to wide form using Python’s pandas library and R’s stats, tidyr and data.table libraries and how they match up.
I did write more annotations on the Python code as I am still learning about the language and while its been pretty easy to pick up, I still need to work through the steps. I’m sure there’s another way to wrangle and shape data in Python besides for pandas; If you know of another one, be sure to leave a comment below and let me know!
Lets go!
The Problem
The problem that we’ll be using will be a problem I saw on StackExchange’s Data Science site. (link to problem: here). Here are the screenshots of the question.
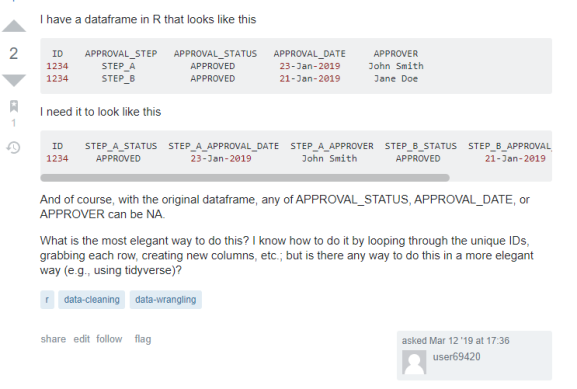
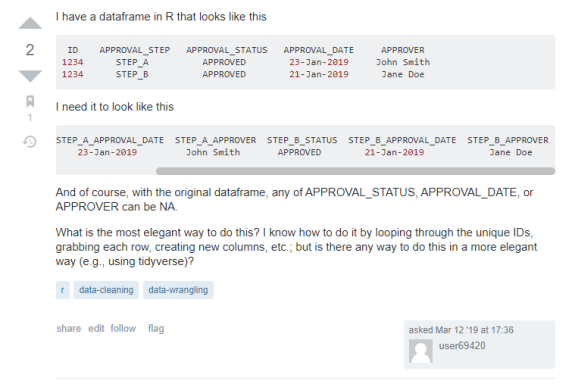
While the OP only asks for how to do this in R. I thought this would be good to show how this works in Python as well! Lets dive right into it!
The Answer(s).
TL;DR: To do the above transformation, Using Python’s pandas library is not as efficient as R’s stats, tidyr or data.table libraries.
Disclaimer: for this problem, I will be focusing on getting the data to its proper form. I won’t rename columns as it is a cosmetic issue.
Python (Pandas library):
First lets input our data:
# The Raw Data


x = {"ID":[1234,1234],
  "APPROVAL_STEP":["STEP_A","STEP_B"],
  "APPROVAL_STATUS":["APPROVED","APPROVED"],
  "APPROVAL_DATE":["23-Jan-2019","21-Jan-2019"],
  "APPROVER":["John Smith","Jane Doe"]}


print(x)


## {'ID': [1234, 1234], 'APPROVAL_STEP': ['STEP_A', 'STEP_B'], 'APPROVAL_STATUS': ['APPROVED', 'APPROVED'], 'APPROVAL_DATE': ['23-Jan-2019', '21-Jan-2019'], 'APPROVER': ['John Smith', 'Jane Doe']}
Now to convert this data into a data frame by using the DataFrame() function from the pandas library.
import pandas as pd


df=pd.DataFrame(x)


df


##      ID APPROVAL_STEP APPROVAL_STATUS APPROVAL_DATE    APPROVER
## 0  1234        STEP_A        APPROVED   23-Jan-2019  John Smith
## 1  1234        STEP_B        APPROVED   21-Jan-2019    Jane Doe
Now, to convert the data into wide form; this can be done by using the .pivot_table() method. We want to index the data based on ID and see each data point based on the step. This can be done with the code below:
df=df.pivot_table(index="ID",
         columns="APPROVAL_STEP",
         aggfunc="first")


df


##               APPROVAL_DATE              APPROVAL_STATUS            \
## APPROVAL_STEP        STEP_A       STEP_B          STEP_A    STEP_B
## ID
## 1234            23-Jan-2019  21-Jan-2019        APPROVED  APPROVED
##
##                  APPROVER
## APPROVAL_STEP      STEP_A    STEP_B
## ID
## 1234           John Smith  Jane Doe
We’re starting to have our data look like what we want it to be . Now, to categorize the columns.
df.columns = ['_'.join(col) for col in df.columns]

df


##      APPROVAL_DATE_STEP_A APPROVAL_DATE_STEP_B APPROVAL_STATUS_STEP_A  \
## ID
## 1234          23-Jan-2019          21-Jan-2019               APPROVED
##
##      APPROVAL_STATUS_STEP_B APPROVER_STEP_A APPROVER_STEP_B
## ID
## 1234               APPROVED      John Smith        Jane Doe
Now, for the finishing touches, we use the .reset_index() method and reorder the columns.
##      ID APPROVAL_DATE_STEP_A APPROVAL_DATE_STEP_B APPROVAL_STATUS_STEP_A  \
## 0  1234          23-Jan-2019          21-Jan-2019               APPROVED
##
##   APPROVAL_STATUS_STEP_B APPROVER_STEP_A APPROVER_STEP_B
## 0               APPROVED      John Smith        Jane Doe

## Error in py_call_impl(callable, dots$args, dots$keywords): KeyError: "['ID'] not in index"
##
## Detailed traceback:
##   File "<string>", line 2, in <module>
##   File "C:\Users\Smith\AppData\Local\r-miniconda\envs\r-reticulate\lib\site-packages\pandas\core\frame.py", line 2806, in __getitem__
##     indexer = self.loc._get_listlike_indexer(key, axis=1, raise_missing=True)[1]
##   File "C:\Users\Smith\AppData\Local\r-miniconda\envs\r-reticulate\lib\site-packages\pandas\core\indexing.py", line 1553, in _get_listlike_indexer
##     keyarr, indexer, o._get_axis_number(axis), raise_missing=raise_missing
##   File "C:\Users\Smith\AppData\Local\r-miniconda\envs\r-reticulate\lib\site-packages\pandas\core\indexing.py", line 1646, in _validate_read_indexer
##     raise KeyError(f"{not_found} not in index")

##      APPROVAL_DATE_STEP_A APPROVAL_DATE_STEP_B APPROVAL_STATUS_STEP_A  \
## ID
## 1234          23-Jan-2019          21-Jan-2019               APPROVED
##
##      APPROVAL_STATUS_STEP_B APPROVER_STEP_A APPROVER_STEP_B
## ID
## 1234               APPROVED      John Smith        Jane Doe
Phew! That was alot of steps to follow to get here! Lets see how R matches up!
R (tidyr package)
The tidyr library is a package made by Hadley Wickam and his team at RStudio. It is one of the many packages in the tidyverse made for managing data. We can solve this problem by using the pivot_wider() function.
# The Raw Data

x<-data.frame(ID=c(1234,1234),
              APPROVAL_STEP=c("STEP_A","STEP_B"),
              APPROVAL_STATUS=c("APPROVED","APPROVED"),
              APPROVAL_DATE=c("23-Jan-2019","21-Jan-2019"),
              APPROVER=c("John Smith","Jane Doe"))

# Use pivot_wider()

library(tidyr)

t<-x %>% pivot_wider(id_cols=ID,
                  names_from=APPROVAL_STEP,
                  values_from =c(APPROVAL_STATUS,APPROVAL_DATE,APPROVER))

t


## # A tibble: 1 x 7
##      ID APPROVAL_STATUS_STEP_A APPROVAL_STATUS_STEP~ APPROVAL_DATE_STEP~ APPROVAL_DATE_STEP~ APPROVER_STEP_A APPROVER_STEP_B
##   <dbl> <fct>                  <fct>                 <fct>               <fct>               <fct>           <fct>
## 1  1234 APPROVED               APPROVED              23-Jan-2019         21-Jan-2019         John Smith      Jane Doe
Now, we just need to reorder the columns.
# Reordered
t<-t[,c(1,2,4,6,3,5,7)]

t


## # A tibble: 1 x 7
##      ID APPROVAL_STATUS_STEP_A APPROVAL_DATE_STEP~ APPROVER_STEP_A APPROVAL_STATUS_STEP~ APPROVAL_DATE_STEP~ APPROVER_STEP_B
##   <dbl> <fct>                  <fct>               <fct>           <fct>                 <fct>               <fct>
## 1  1234 APPROVED               23-Jan-2019         John Smith      APPROVED              21-Jan-2019         Jane Doe
R (stats package)
Using the reshape() function from R’s stats package is a more “old school” way of doing this because it’s something more popular with people who have learned how to write R pre-tidyverse era. Being that I’ve initially learned R from people who programmed pre-tidyverse, I learned how to do this. This can all be done with one function without having to reorder columns!
(This can also be seen on my answer to this question on Data Science StackExchange page)
library(stats)

reshape(x,
    timevar="APPROVAL_STEP",
    idvar="ID",
    sep="_", direction = "wide")


##     ID APPROVAL_STATUS_STEP_A APPROVAL_DATE_STEP_A APPROVER_STEP_A APPROVAL_STATUS_STEP_B APPROVAL_DATE_STEP_B
## 1 1234               APPROVED          23-Jan-2019      John Smith               APPROVED          21-Jan-2019
##   APPROVER_STEP_B
## 1        Jane Doe
There you have it! Everything with one function!
R (data.table package)
Casper Crause pointed out that this task can also be done with the data.table package.
The advantage of using this over tidyr or the stats packages is that data.table is written largely in C (see breakdown in languages used on Github page linked). So for larger datasets, using this in a script will save more time computationally.
The quirk here is that your data frame needs to be converted to a data table (which for this example was not hard at all). But throwing this into dcast() works like a charm and puts your shaping of data in “mathematical” terms where the ID variables (rows) are placed on the left hand side and your measuring variables are placed on the right hand side.
Thank you Casper for pointing this out!
library(data.table)
x <-as.data.table(x)
dcast(
  data       = x,
  formula  = ID~...,
  value.var = c("APPROVAL_STATUS", "APPROVAL_DATE","APPROVER")
  )


##      ID APPROVAL_STATUS_STEP_A APPROVAL_STATUS_STEP_B APPROVAL_DATE_STEP_A APPROVAL_DATE_STEP_B APPROVER_STEP_A
## 1: 1234               APPROVED               APPROVED          23-Jan-2019          21-Jan-2019      John Smith
##    APPROVER_STEP_B
## 1:        Jane Doe
Conclusion
While there are ways to pivot data from long to wide form in both Python and R, using R makes for a less labor intensive and intuitive time for shaping data as opposed to Python. I am learning that both languages have their strengths, but for this data-wrangling challenge R saves time working through those sort of details.
If you write in R or Python and have an alternative/better solution to answering this problem (or see a mistake) please feel free to reach out to me in a comment or message to share it with me!
R-bloggers.com offers daily e-mail updates about R news and tutorials about learning R and many other topics. Click here if you're looking to post or find an R/data-science job.
Want to share your content on R-bloggers? click here if you have a blog, or here if you don't.