# R Libraries
library("reticulate")

knitr::opts_chunk$set(
  fig.width = 15,
  fig.height = 8,
  out.width = '100%')
# Choose Python 3.7 miniconda
reticulate::use_condaenv(
  condaenv = "r-reticulate",
  required = TRUE
  )
# Install Python packages
lapply(c("plotnine"), function(package) {
       conda_install("r-reticulate", package, pip = TRUE)
})
# Python libraries
from datatable import *
import numpy as np
import plotnine as p9
import re
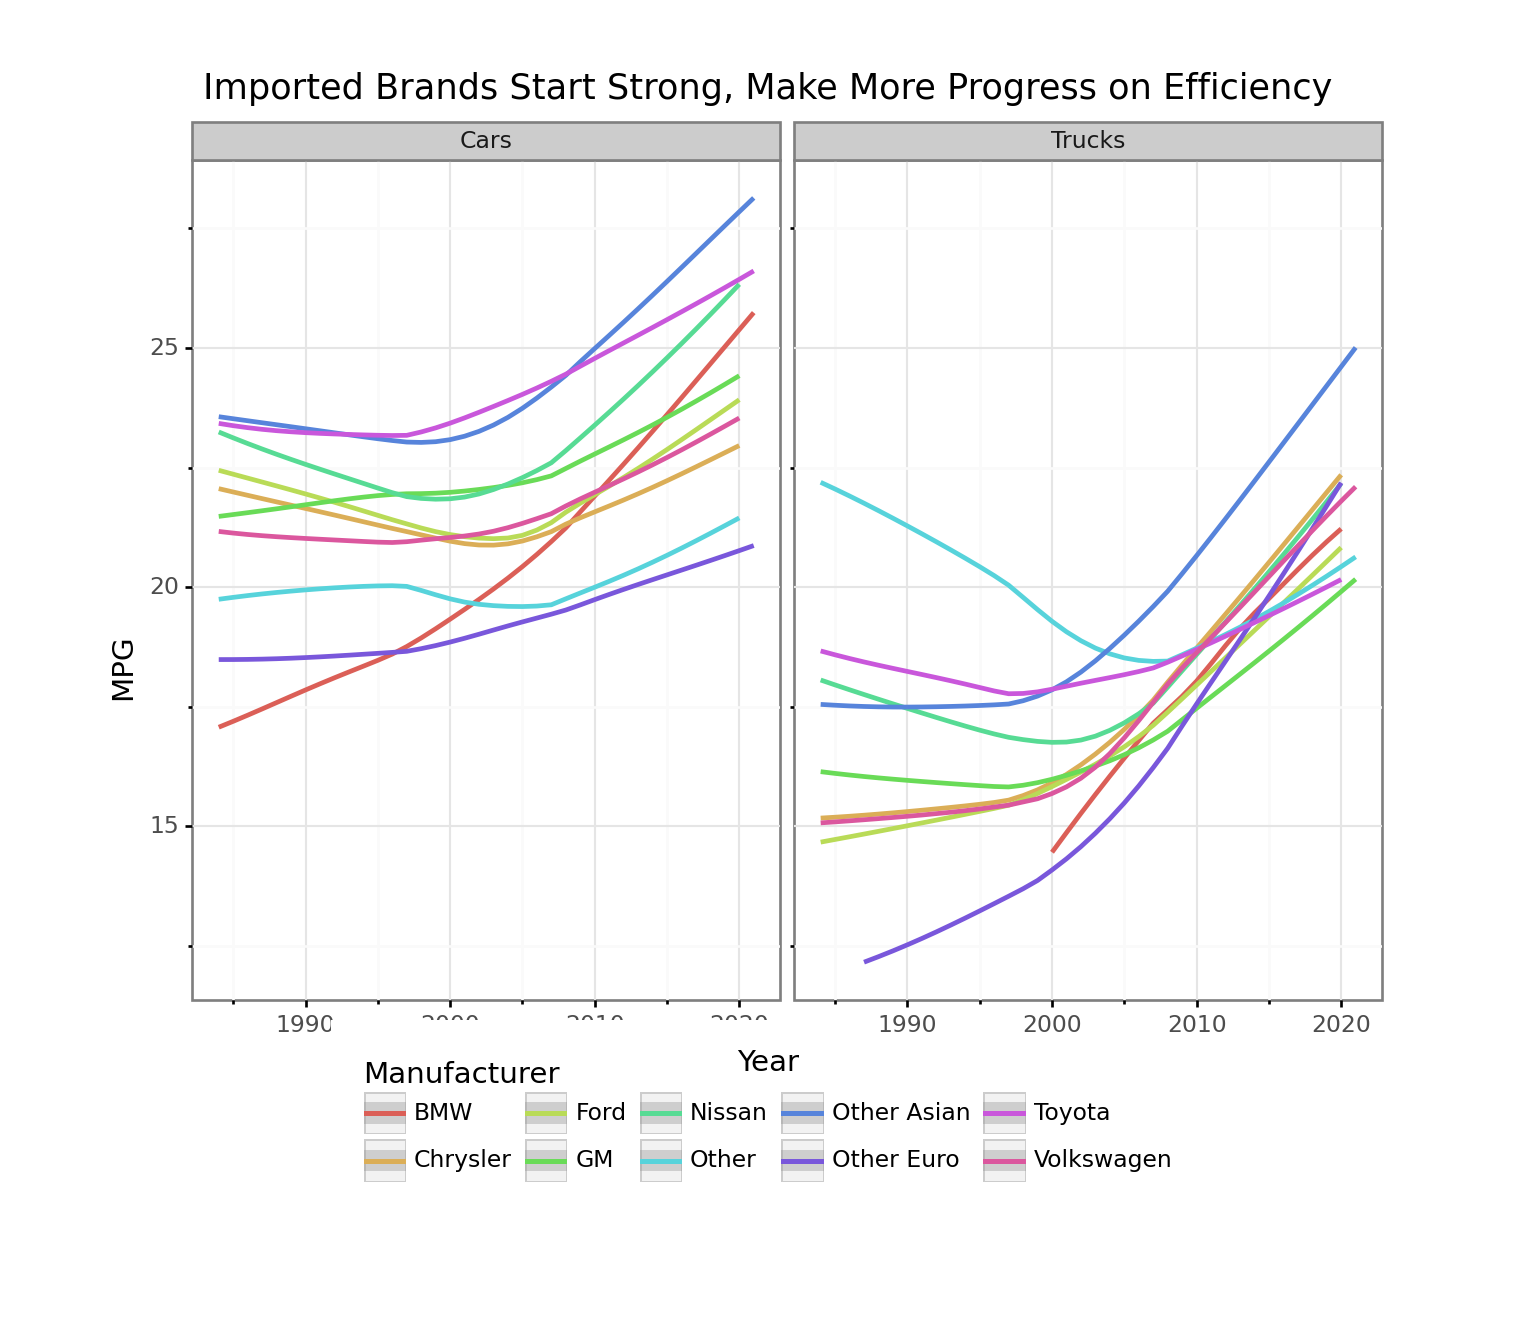
Introduction
In this post, we start out where we left off in Exploring Big MT Cars with Python datatable and plotnine-Part 1. In the chunk below, we load our cleaned up big MT Cars data set in order to be able to refer directly to the variable ...