May 2020

Use basic operators

May 8, 2020 | Quantargo Blog

R is not only good for analysing and visualizing data, but also for solving maths problems or comparing data with each other. Plus you can use it just like a pocket calculator. Use R as a pocket calculator Use arithmetic operators on vectors Use relational operators on vectors Use logical ...
[Read more...]

Same Time Next Year: crunching PubMed data

May 8, 2020 | quantixed

I am giving a talk next week and wanted to update some plots from an old analysis that previously featured on quantixed. The question is: how long does it take for a paper get published? The answer is complex (as previously discussed on quantixed), but we can at least find ...
[Read more...]

Machined risk premia

May 7, 2020 | R on OSM

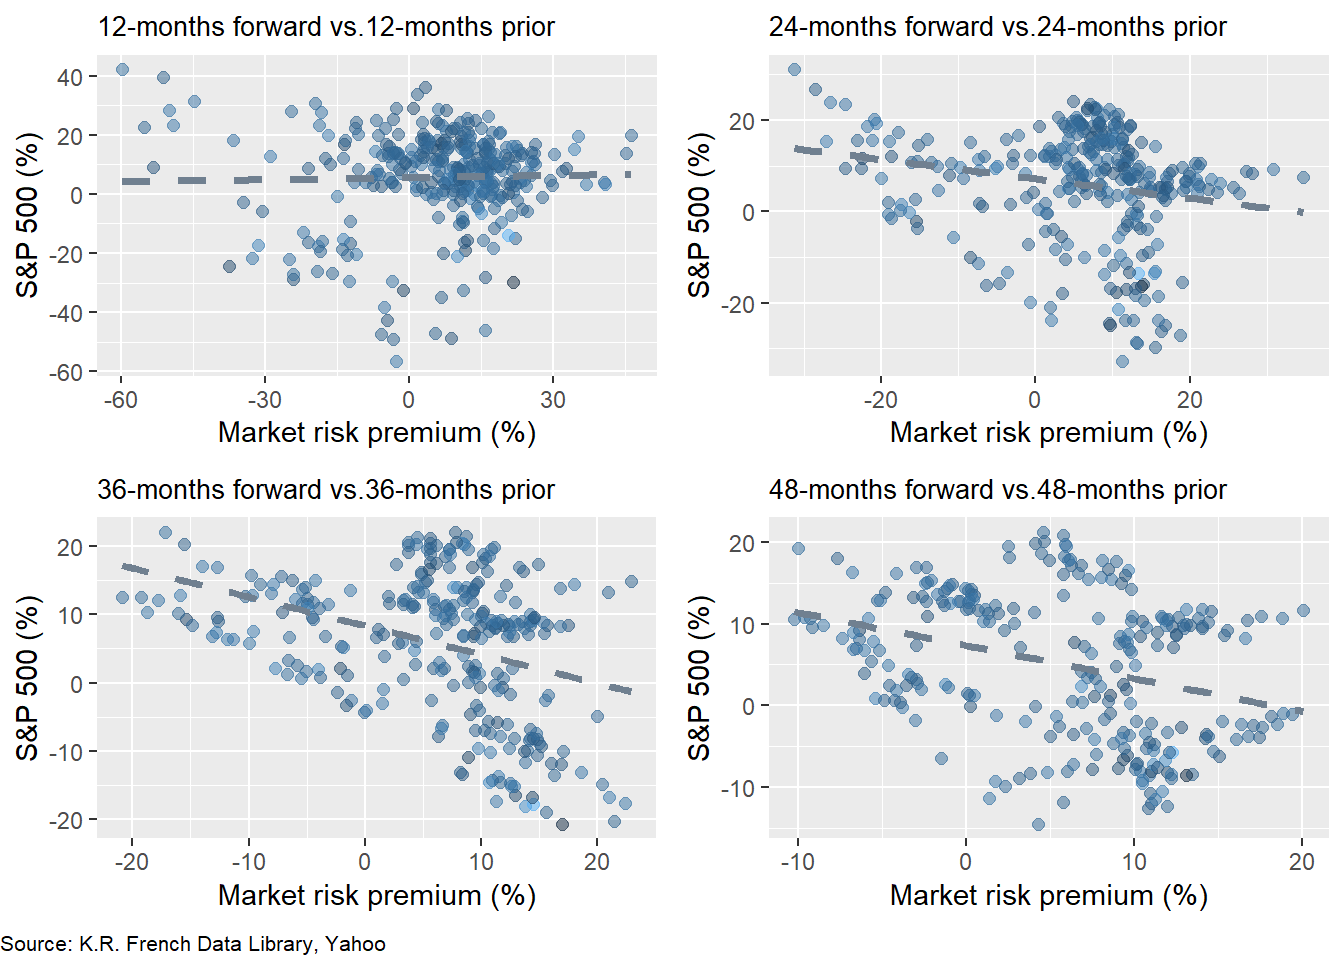
Over the last few posts, we’ve discussed methods to set return expectations to construct a satisfactory portfolio. These methods are historical averages, discounted cash flow models, and risk premia. our last post, focused on the third method: risk ...
[Read more...]

Machined risk premia

May 7, 2020 | R on OSM

Over the last few posts, we’ve discussed methods to set return expectations to construct a satisfactory portfolio. These methods are historical averages, discounted cash flow models, and risk premia. our last post, focused on the third method: risk premia. Using the Capital Asset Pricing Model (CAPM) one can derive ...
[Read more...]

Some Upcoming R Related, Virtual Events

May 7, 2020 | R Views

COVID-19 Data Forum Webinar - Next Thursday (5/14/20) at Noon Pacific time, the COVID-19 Data Forum, sponsored by R Consortium and the Stanford Data Science Institute will open with a public webinar. The purpose of the Forum is to provide a way for experts to focus on data-related aspects of the ...
[Read more...]

Exploring Big MT Cars with Python datatable-Part 1

May 6, 2020 | R on Redwall Analytics

# R Libraries
library("reticulate")
library("skimr")

knitr::opts_chunk$set(
  fig.width = 15,
  fig.height = 8,
  out.width = '100%')
# Install Python packages
lapply(c("datatable", "pandas"), function(package) {
       conda_install("r-reticulate", package, pip = TRUE)
})
# Python libraries
from datatable import *
import numpy as np
import re
import pprint
Introduction As mentioned in our last series Parsing Mass Municipal PDF CAFRs with Tabulizer, pdftools and AWS Textract - Part 1 and A Walk Though of Accessing Financial Statements with XBRL in R - Part 1, this is a year of clean-up. Redwall Analytics is going through this year, ... [Read more...]
1 12 13 14 15 16 17

Never miss an update!
Subscribe to R-bloggers to receive
e-mails with the latest R posts.
(You will not see this message again.)

Click here to close (This popup will not appear again)