January 2020

pointblank v0.3

January 12, 2020 | Posts | R & R

English French German The newest release of the pointblank package makes it really easy to validate your data with workflows attuned to your data quality needs. You can install pointblank 0.3 from CRAN with:
install.packages("pointblank")
The design goals of pointblank are to enable two important data validation workflows with a common ...
[Read more...]

OMG O2G!

January 12, 2020 | R on OSM

The oil-to-gas ratio was recently at its highest level since October 2013, as Middle East saber-rattling and a recovering global economy supported oil, while natural gas remained oversupplied despite entering the major draw season. Even though the ratio has eased in the last week, it remains over one standard deviation above ...
[Read more...]

Data Science Essentials

January 11, 2020 | Jesse Cambon

One the greatest strengths of R for data science work is the vast number and variety of packages and capabilities that are available. However, it can be intimidating to navigate this large and dynamic open source ecosystem, especially for a newcomer. All the information you need is out there, but ...
[Read more...]

New vtreat Feature: Nested Model Bias Warning

January 11, 2020 | John Mount

For quite a while we have been teaching estimating variable re-encodings on the exact same data they are later naively using to train a model on, leads to an undesirable nested model bias. The vtreat package (both the R version and Python version) both incorporate a cross-frame method that allows ... [Read more...]

Shiny Dashboards with Flexdashboard

January 11, 2020 | Tim M. Schendzielorz

Build beautiful dashboards rapidly. Example Flexdashboard. From shinyapps.ioThis is part one of a growing series on data reporting with micro services. For deploying web apps and this Flexdashboard in particular see part two, Deploying a Shiny Flexdashboard with Docker. For deploying dashboards at scale in production with a Shiny ...
[Read more...]

postdoc at Warwick on robust SMC [call]

January 11, 2020 | xi'an

Here is a call for a research fellow at the University of Warwick to work with Adam Johansen and Théo Damoulas on the EPSRC and Lloyds Register Foundaton funded project “Robust Scalable Sequential Monte Carlo with application to Urban Air Quality”. To quote The position will be based primarily ...
[Read more...]

Automate Your Repetitive Reports!

January 9, 2020 | R on Curious Joe

What is R script automation and why? Outline of what we’ll do here Part01: Creating the report: Part02: Automating the report reproduction What is R script automation and why? In most use cases R is used to analyze data, run statistical tests and build model. In doing so, data ...
[Read more...]

heatmaply 1.0.0 – beautiful interactive cluster heatmaps in R

January 9, 2020 | Tal Galili

I’m excited to announce that heatmaply version 1.0.0 has been published to CRAN! (getting started vignette is available here) What is heatmaply? heatmaply is an R package for easily creating interactive cluster heatmaps that can be shared online as a stand-alone HTML file. Interactivity includes a tooltip display of values ...
[Read more...]

Variable selection with multGLM

January 9, 2020 | A.M. Barbosa

The ‘multGLM‘ function in the ‘fuzzySim‘ R package automatically calculates generalized linear models for one or more species, with a range of options for variable selection. However, you may want to build your final models with other methods (e.g. multimodel-inference … Continue reading → [Read more...]

A Year in Flow

January 8, 2020 | AdventuresInData

Revisiting the river flow profile plot from an earlier post, the video below loops each day's flow profile for the Delaware River in 2019.  Data is from USGS gages processed using R and Windows Live Movie Maker. [Read more...]

World map of visited countries in R

January 8, 2020 | R on Stats and R

Like me, if you like traveling as much as R you might want to draw a world map of the countries you have visited in R. Below an example with the countries I have visited as of January 2020: To draw this map in R, you will need the following packages: {{... [Read more...]

Optimal Decision Boundaries

January 8, 2020 | Ryan Holbrook

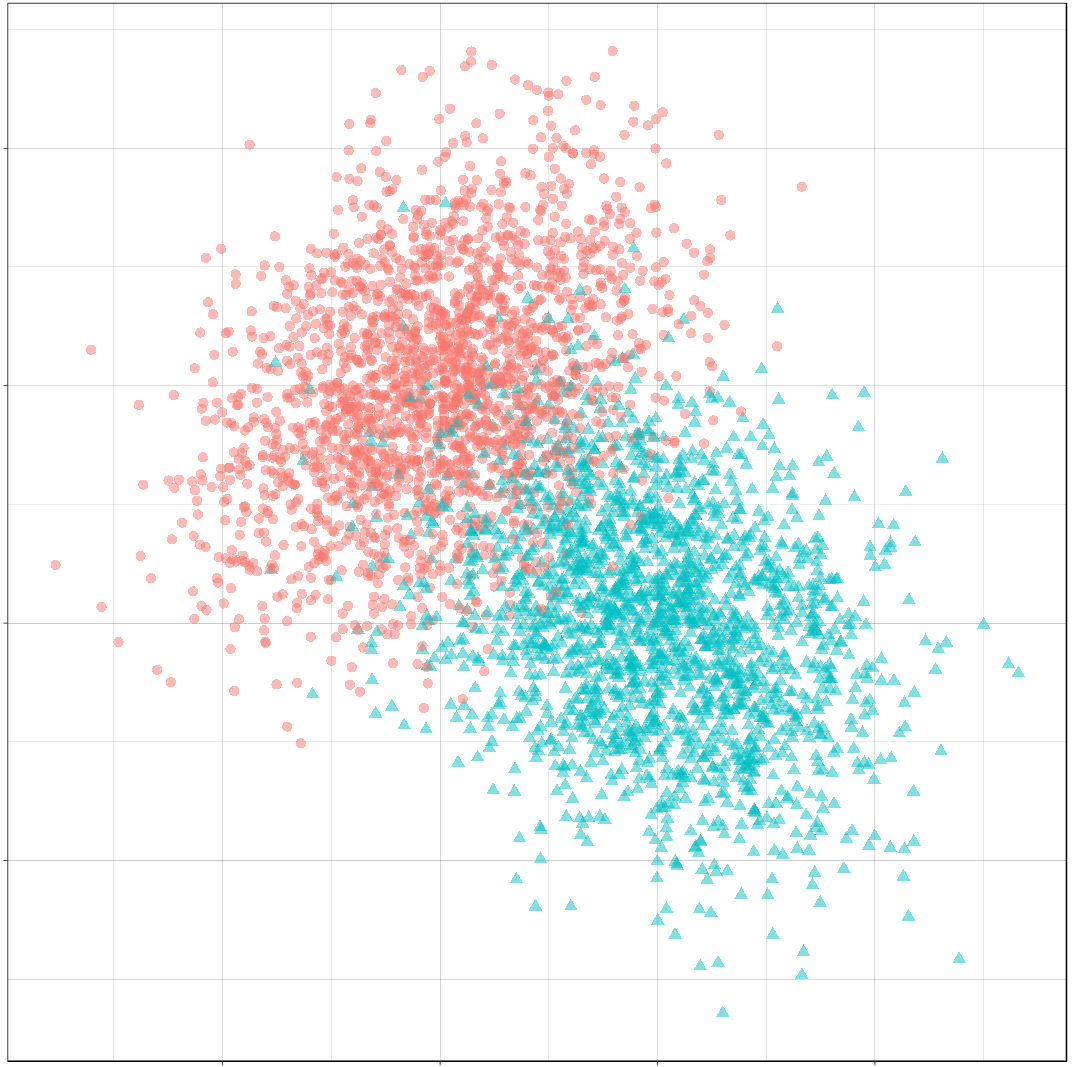
Introduction Over the next few posts, we will investigate decision boundaries. A decision boundary is a graphical representation of the solution to a classification problem. Decision boundaries can help us to understand what kind of solution might be appropriate for a problem. They can also help us to understand the ...
[Read more...]

World map of visited countries in R

January 8, 2020 | R on Stats and R

Like me, if you like traveling as much as R you might want to draw a world map of the countries you have visited in R. Below an example with the countries I have visited as of January 2020: To draw this map in R, you will need the following packages: {{... [Read more...]
1 8 9 10 11 12 13

Never miss an update!
Subscribe to R-bloggers to receive
e-mails with the latest R posts.
(You will not see this message again.)

Click here to close (This popup will not appear again)