August 2019

A weighty matter

August 8, 2019 | R on OSM

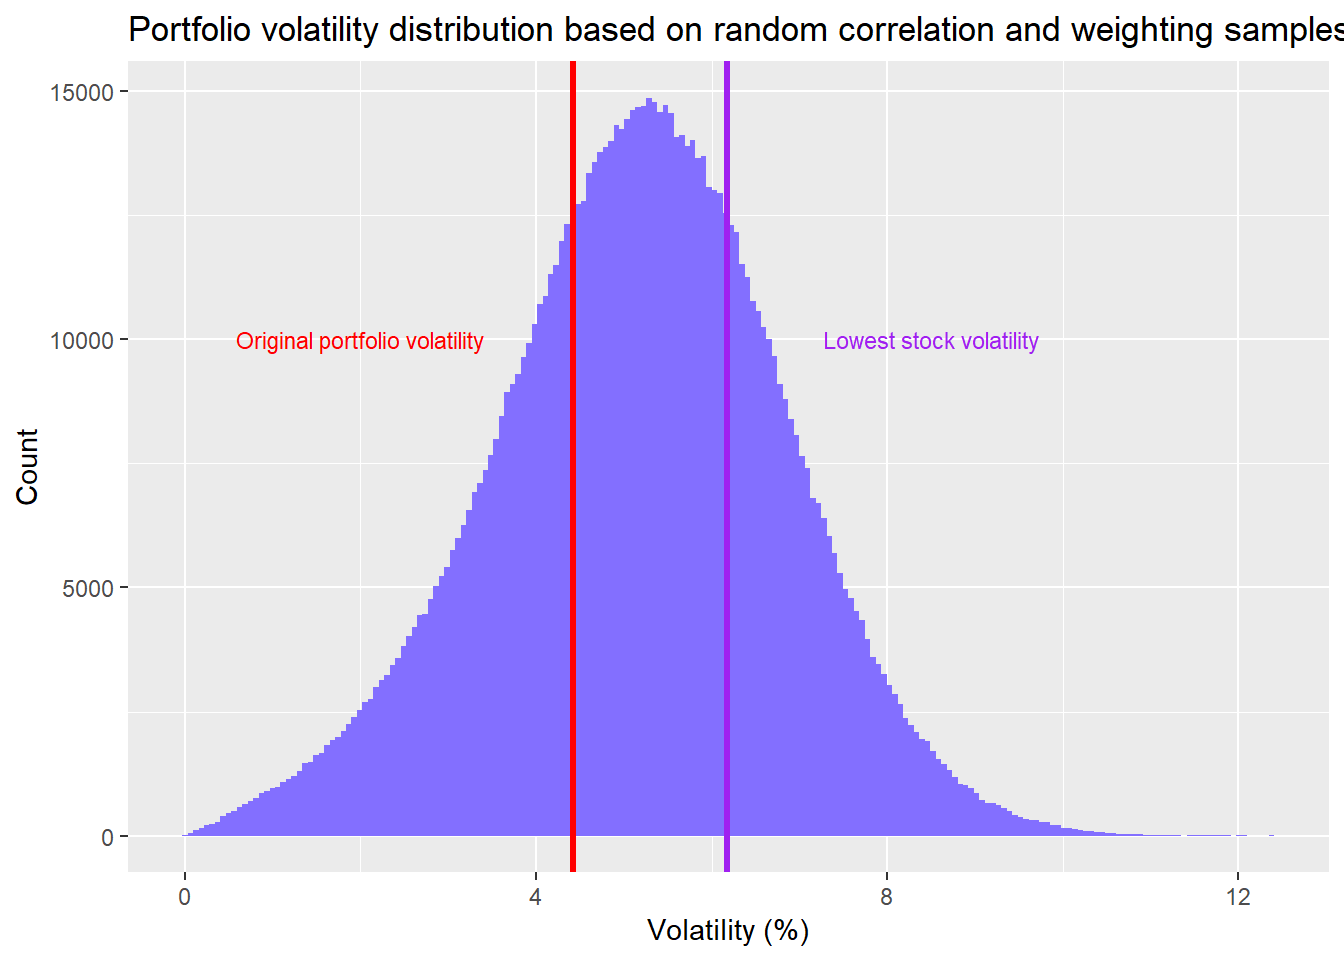
When we were testing random correlations and weighthings in our last post on diversification, we discovered that randomizing correlations often increased portfolio risk. Then, when we randomized stock weightings on top of our random correlations, we...
[Read more...]

A weighty matter

August 8, 2019 | R on OSM

When we were testing random correlations and weighthings in our last post on diversification, we discovered that randomizing correlations often increased portfolio risk. Then, when we randomized stock weightings on top of our random correlations, we began to see more cases in which one would have better off not being ...
[Read more...]

A New Website

August 8, 2019 | Noam Ross

For me, the task of building a personal website is fraught with so many of my technical, aesthetic, and personal hangups that I hadn’t updated mine since mid-graduate school. Thanks to consistent pestering by Maëlle, though, I finally got around to re-building this one using a modern toolkit. ... [Read more...]

How to Do Mediation Scientifically

August 8, 2019 | Rstats on pi: predict/infer

Mediation analysis has been around a long time, though its popularity has varied between disciplines and over the years. While some fields have been attracted to the potential of mediation models to identify pathways, or mechanisms, through which an independent variable affects an outcome, others have been skeptical that the ... [Read more...]

Speeding up Bayesian sampling with map_rect

August 8, 2019 | Brian Callander

Speeding up Bayesian sampling with map_rect Posted on 9 August, 2019 by Brian Tags: stan, map_rect, within-chain parallelisation, threading, ordinal regression Category: map_rect Fitting a full Bayesian model can be slow, especially with a large dataset. For example, it’d be great to analyse the climate crisis questions in ... [Read more...]

Reversi in R – Part 2: Graphics and Custom Boards

August 8, 2019 | Jack Davis

In this post, I finish the Reversi / Othello game in R by improving the graphics, adding the ability to save and load boards, and fixing bugs. Also, many more boards have been added and tested, including those with unusual shapes, three or more players, and walls that can make the ...
[Read more...]

Shapiro-Wilk Test for Normality in R

August 7, 2019 | data technik

I think the Shapiro-Wilk test is a great way to see if a variable is normally distributed. This is an important assumption in creating any sort of model and also evaluating models. Let’s look at how to do this in R! And here is the output: So how do ...
[Read more...]

In search of the perfect partial plot

August 7, 2019 | Artful Analytics

Introduction Partial dependence (PD) plots are essential for interpreting Random Forests models. For example, in the case of binary classification, PD plots show the marginal effect of individual predictor variables on the probability of the response. Several packages in R will generate PD plots for Random Forests, but I’ve ...
[Read more...]

A Flurry of Facets

August 7, 2019 | Data Imaginist

When I announced the last release of ggforce I hinted that I would like to transition to a more piecemeal release habit and avoid those monster releases that the last one was. True to my word, I am now thrilled to announce that a new version of ggforce is available ...
[Read more...]

B3 is NOT shutting down its ftp site, for now..

August 7, 2019 | R on msperlin

Surprise, surprise. B3’s ftp site is still up and running. Following previous post regarding the shutdown of B3’s ftp site and its impact over GetHFData, I’m happy to report that the site is up and running. We can check it with code:
library(GetHFData)
library(tidyverse)

df.ftp <- ghfd_get_ftp_contents(type.market = 'equity')
## 
## Reading ftp contents for equity(trades) (attempt = 1|10)
# check time difference
max(df.ftp$dates) - min(df.ftp$dates)
## Time difference of 158 days
Let’... [Read more...]

tikzDevice v0.12.3

August 7, 2019 | R on Ralf Stubner

Yesterday tikzDevice version 0.12.3 made it unto CRAN and is now propagating to the mirrors. The tikzDevice package provides a graphics output device for R that records plots in a LaTeX-friendly format. The device transforms plotting commands issued by R functions into LaTeX code blocks. When included in a paper typeset ... [Read more...]

Data Warehousing and Data Mining

August 7, 2019 | Jonathan

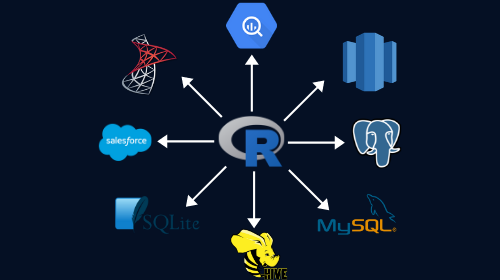
The relationship between data mining tools and data warehousing systems can be most easily seen in the connector options of popular analytics software packages. For example, the image below right shows the many source options from which to pull data in from warehouse backends in Tableau Desktop. Microsoft Power BI ...
[Read more...]

Getting Started with Data Science

August 7, 2019 | Pranjali Galgali

A data scientist is someone who uses computer programming, statistics, and mathematics to derive meaningful insights from large quantities of data. For example, a data scientist might conduct a cluster analysis of customer characteristics to inform a marketing campaign or build a machine learning model to diagnose cancer.
[Read more...]
1 9 10 11 12 13 14

Never miss an update!
Subscribe to R-bloggers to receive
e-mails with the latest R posts.
(You will not see this message again.)

Click here to close (This popup will not appear again)