May 2019

Quick and easy t-SNE analysis in R

May 30, 2019 | chris2016

t-SNE is a useful dimensionality reduction method that allows you to visualise data embedded in a lower number of dimensions, e.g. 2, in order to see patterns and trends in the data. It can deal with more complex patterns of Gaussian clusters in multidimensional space compared to PCA. Although is ...
[Read more...]

Bayesian modeling using Stan: A case study

May 30, 2019 | Fabian Dablander

Practice makes better. And faster. But what exactly is the relation between practice and reaction time? In this blog post, we will focus on two contenders: the power law and exponential function. We will implement these models in Stan and extend them to account for learning plateaus and the fact ...
[Read more...]

xaibot – conversations with predictive models!

May 30, 2019 | smarterpoland

If you could talk to a predictive machine learning model, what would you ask for? Try! Michał Kuźba is developing a mind-blowing project – xai chat-bot. Dialog based system that helps to explore and understand predictive models through natural language conversations (type, speak or phone the model ???? ). For example, imagine ... [Read more...]

Cognitive capitalism chapter reworked

May 29, 2019 | Derek Jones

The Cognitive capitalism chapter of my evidence-based software engineering book took longer than expected to polish; in fact it got reworked, rather than polished (which still needs to happen, and there might be more text moving from other chapters). Changing the chapter title, from Economics to Cognitive capitalism, helped clarify ... [Read more...]

April 2019: “Top 40” New CRAN Packages

May 29, 2019 | R Views

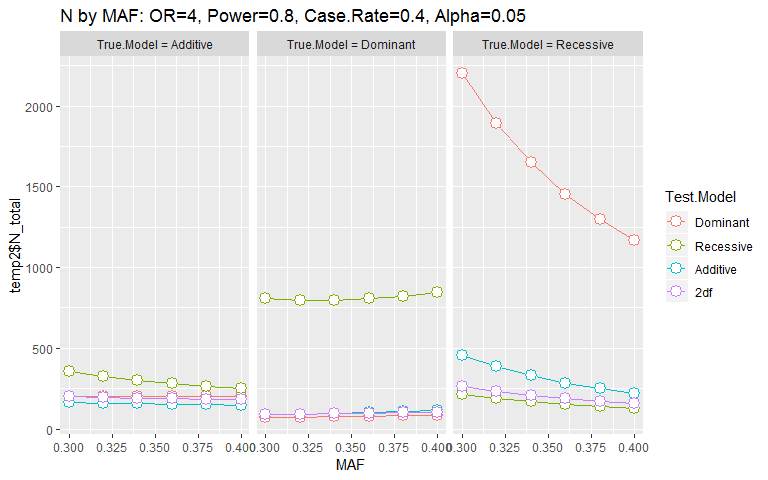
One hundred eighty-seven new packages made it to CRAN in April. Here are my picks for the “Top 40”, organized into ten categories: Biotechnology, Data, Econometrics, Machine Learning, Medicine, Science, Statistics, Time Series, Utilities, and Visualization. Biotechnology genpwr v1.00: Provides functions for power and sample size calculations for genetic association studies ...
[Read more...]

Interactive charts with chartbookR

May 28, 2019 | Posts on Applied Economic R-esearch

“There is no such thing as information overload. There is only bad design.” (— Edward Tufte). There is nothing worse than charts overladed with information. One solution to this are interactive charts that let users select the time series they’re interested in, zoom in on them, and focus on individual ... [Read more...]

Momentum Investing with R

May 28, 2019 | R Views

After an extended hiatus, Reproducible Finance is back! We’ll celebrate by changing focus a bit and coding up an investment strategy called Momentum. Before we even tiptoe in that direction, please note that this is not intended as investment advice and it’s not intended to be a script ...
[Read more...]

Employee flight risk modeling behavior

May 28, 2019 | Ashish Dutt

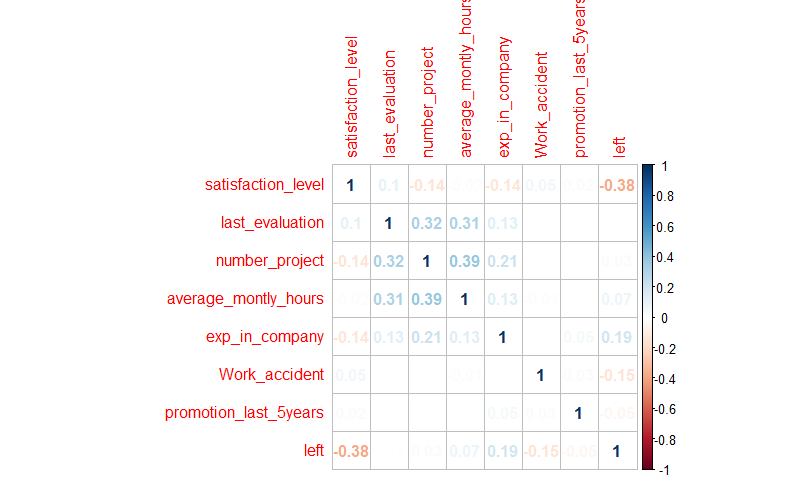
An analytical model for predicting employee flight risk behaviour “People are the nucleus of any organization. So, how can you find, engage and retain top performers who’ll contribute to your goals, your future?” There is no dearth of Enterpris...
[Read more...]

How to keep up with CRAN policies and processes?

May 28, 2019 | R-hub blog

CRAN, the Comprehensive R Archive Network, changes its rules and workflow every so often: see for instance the new encoding setting of one of its check flavors. As a package developer, you’d better keep up with CRAN policies and processes to be able to safely retain your package(s) ... [Read more...]

What single step does with relationship

May 28, 2019 | mrtnj

We had a journal club about the single step GBLUP method for genomic evaluation a few weeks ago. In this post, we’ll make a few graphs of how the single step method models relatedness between individuals. Imagine you want to use genomic selection in a breeding program that already ...
[Read more...]

Package Spotlight: anim.plots

May 28, 2019 | Dr. Jack Davis

The package anim.plots behaves like a sort of user-friendly shell on top of animate that makes animations of some of the most common types of plots in base R in a more intuitive fashion that animate. This package depends on two other important packages: -   magick, which is an ... [Read more...]

Learning R: Painting with Fire

May 28, 2019 | Learning Machines

A few months ago I published a post on recursion: To understand Recursion you have to understand Recursion…. In this post we will see how to use recursion to fill free areas of an image with colour, the caveats of recursion and how to transform a recursive algorithm into a ... [Read more...]

Job @ Oxford

May 27, 2019 | R | Gianluca Baio

Boby Mihaylova has two exciting posts available at the Health Economics Research Centre at the University of Oxford. In particular, she is looking for two R-minded researchers/analysts to develop work on disease modelling/cost-effectiveness using large... [Read more...]

Individuals Control Charts

May 27, 2019 | R on jmarriott.com

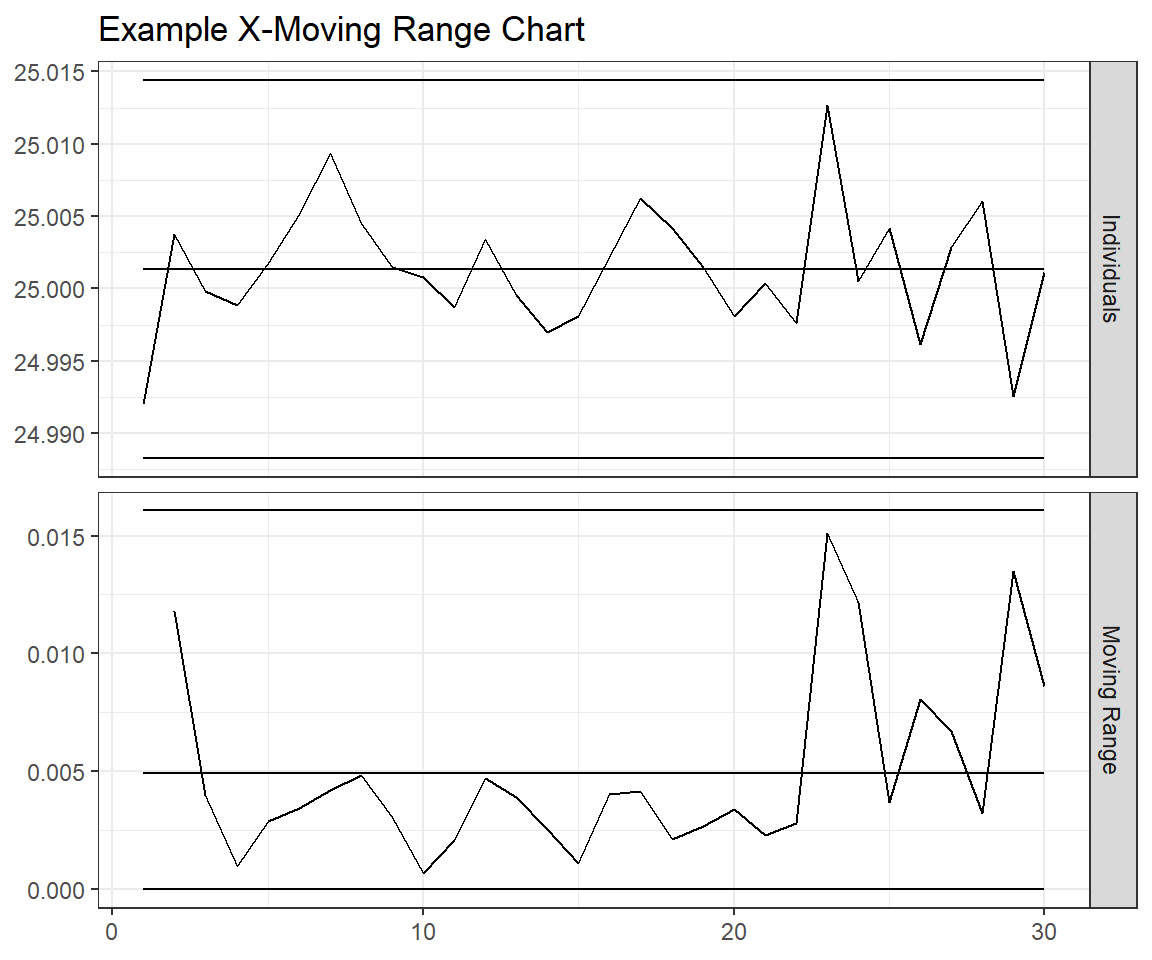
This post is a follow-up two my two recent posts on generating control charts in R, and animating them. One thing that I’ve been wondering about is how to calculate a range chart without using a package like ggQC or qcc. I knew that I could do it using ...
[Read more...]
1 2 3 4 14

Never miss an update!
Subscribe to R-bloggers to receive
e-mails with the latest R posts.
(You will not see this message again.)

Click here to close (This popup will not appear again)