April 2018

N is for N (Sample Size) Estimation: Power Analysis in R

April 16, 2018 |

N Estimation We're pushing forward in the Blogging A to Z Challenge! Today, I'll talk about conducting power analyses in R with the pwr package. It's amazing the number of studies designed and conducted without the aid of power analysis. Once I learned how to do them in grad school, ...
[Read more...]

Dynamic Online Tests with Blackboard and R/exams

April 15, 2018 | R/exams

Step-by-step guide to generating, importing, and conducting online tests and quizzes generated by exams2blackboard() in R/exams. Online tests and quizzes conducted in learning management systems are a highly useful tool for students to practice course and materials and for teachers to monitor the progress students make while working ... [Read more...]

Coming to $terms in R

April 15, 2018 | sslezak

A recent analysis I worked on involved building a log regression and some ensemble methods using a data set with about 25 features, in addition to the target. It was an analysis of customer churn in the telecom industry. If you are interested, you can find the problem statement here, the ... [Read more...]

#18: Adding Intel MKL easily via a simple script

April 15, 2018 | Thinking inside the box

Welcome to the eighteenth post in the rarely riveting R ramblings series of posts, or R4 for short. The Intel Math Kernel Library (MKL) is well-know high(er) performance math library tailored for Intel CPUs offering best-in-class numerical performance on a number of low-level operations (BLAS, LAPACK, ...). They are not ... [Read more...]

Statistics Sunday: Fit Statistics in Structural Equation Modeling

April 15, 2018 |

Fit Measures In my video on interpreting confirmatory factor analysis output, I promised a post on the various fit statistics. And here we are! As I said in the video, when you conduct structural equation modeling, the program is comparing the observed data - specifically the observed covariance matrix - ... [Read more...]

Applied Economic Analysis With R – Part 1: Exercises

April 15, 2018 | Nosha Assare

R has great potential in Economic data analysis, as well as econometrics. In this set of exercises, we will go through a wide variety of topics in econometrics, including wage equations, growth regressions, dynamic regressions and time series models, hedonic regressions, the demand for health care, and labor force participation. ...
[Read more...]

M is for R Markdown Files

April 14, 2018 |

Today's A to Z of R will be a bit different from previous ones in that the focus is not on how to code something in R, but how to use a feature in R Studio to create documents, such as HTML and PDF. Either of these types of documents ...
[Read more...]

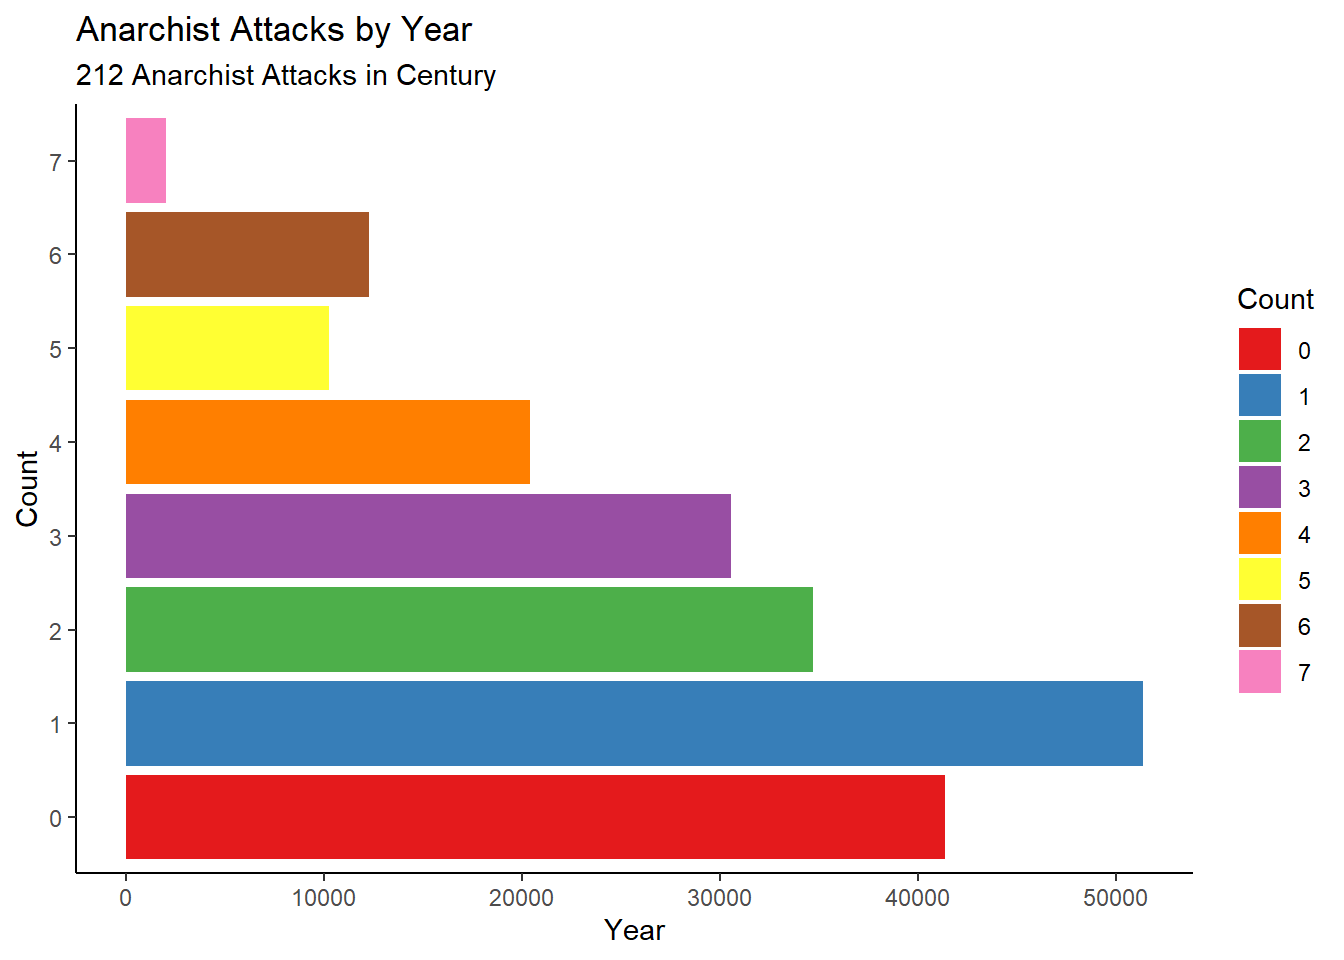
Riddler Express: Arithmetic Anarchists Attack

April 13, 2018 | R on R(e)Thinking

On the April 6, 2018 FiveThirtyEight Riddler Express The Riddler is the excellent math and logic puzzle weekly by Oliver Roeder. Puzzles are posted every friday, together with the solutions to the previous week’s puzzles. I occasionally submit proposed solutions, using R whenever possible. Yesterday Ollie was kind enough to give ...
[Read more...]

forecast v8.3 now on CRAN

April 13, 2018 | R on Rob J Hyndman

The latest version of the forecast package for R is now on CRAN. This is the version used in the 2nd edition of my forecasting textbook with George Athanasopoulos. So readers should now be able to replicate all examples in the book using only CRAN pack...
[Read more...]

Point arrows to specific parts of the data

April 13, 2018 | Roman Luštrik

tl;dr: Point arrows at your line at defined datum points. Sometimes to really enhance your picture you need to point at some stuff. Here is a script which will plot vertical lines to show events in your datum plot. library(ggplot2) # This script will draw points to parts of (... [Read more...]
1 6 7 8 9 10 15

Never miss an update!
Subscribe to R-bloggers to receive
e-mails with the latest R posts.
(You will not see this message again.)

Click here to close (This popup will not appear again)