June 2017

R Seminar on programming with vectors

June 24, 2017 | Jack Davis

This is the first of five seminars that was given at Simon Fraser University. I've included this one in the blog because it makes for, hopefully, an excellent tutorial for intermediate users of R.Inside:- Vector operations- Building a matrix- Matrix operations- Arrays, data frames, and data tables- Indices- ... [Read more...]

Using tidycensus and leaflet to map Census data

June 23, 2017 | Rstats on Julia Silge

Recently, I have been following the development and release of Kyle Walker’s tidycensus package. I have been filled with amazement, delight, and well, perhaps another feeling… There should be a word for “the regret felt when an R ?, which would have saved untold hours of your life, is released”… #... [Read more...]

Track changes in data with the lumberjack %>>%

June 23, 2017 | mark

So you are using this pipeline to have data treated by different functions in R. For example, you may be imputing some missing values using the simputation package. Let us first load the only realistic dataset in R __ data(retailers, … Continue reading →
[Read more...]

The R community is one of R’s best features

June 23, 2017 | David Smith

R is incredible software for statistics and data science. But while the bits and bytes of software are an essential component of its usefulness, software needs a community to be successful. And that's an area where R really shines, as Shannon Ellis explains in this lovely ROpenSci blog post. For ... [Read more...]

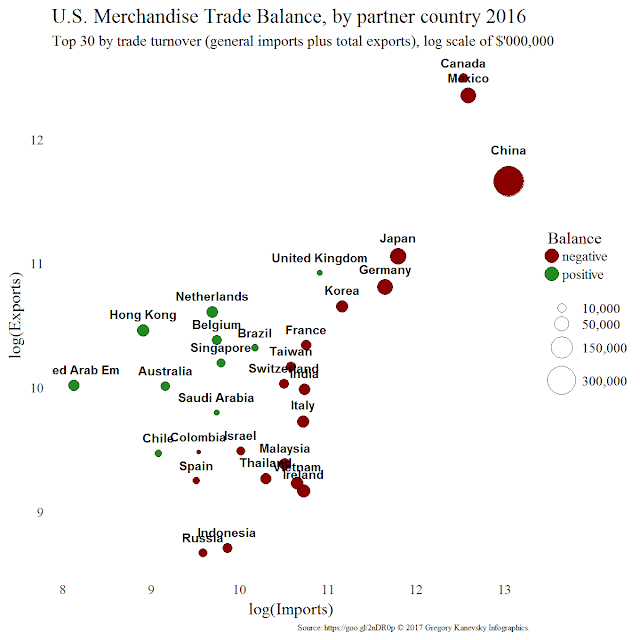
Logarithmic Scale Explained with U.S. Trade Balance

June 23, 2017 | Gregory Kanevsky

Skewed data prevail in real life. Unless you observe trivial or near constant processes data is skewed one way or another due to outliers, long tails, errors or something else. Such effects create problems in visualizations when a few data elements are much larger than the rest. Consider U.S. 2016 ...
[Read more...]

Working With SPSS© Data in R

June 23, 2017 | Mauricio Vargas S. 帕夏

Introduction I was in need of importing SPSS© data for work. There are some options but I've used both foreign and haven R packages. I prefer haven because it integrates better with R's tidyverse and started using it in detriment of foreign when I verified it behaves well with factors ... [Read more...]

Operations Research with R

June 23, 2017 | blogisr

Stefan Feuerriegel This blog entry concerns our course on “Operations Reserch with R” that we teach as part of our study program. We hope that the materials are of value to lectures and everyone else working in the field of numerical optimiatzion. Course outline The course starts with a review ... [Read more...]

Hey! You there! You are welcome here

June 23, 2017 | Shannon E. Ellis

What's that? You've heard of R? You use R? You develop in R? You know someone else who's mentioned R? Oh, you're breathing? Well, in that case, welcome! Come join the R community! We recently had a group discussion at rOpenSci's #runconf17 in Los Angeles, CA about the R community. ...
[Read more...]

Face Recognition in R

June 22, 2017 | Scott Stoltzman

Face Recognition in R OpenCV is an incredibly powerful tool to have in your toolbox. I have had a lot of success using it in Python but very little success in R. I haven’t done too much other than searching Google but it seems as if “imager” and “videoplayR” ...
[Read more...]

May New Package Picks

June 22, 2017 | R Views

Two hundred and twenty-nine new packages were submitted to CRAN in May. Here are my picks for the “Top 40”, organized into five categories: Data, Data Science and Machine Learning, Education, Miscellaneous, Statistics and Utilities. Data angstroms v0.0.1: Provides helper functions for working with Regional Ocean Modeling System (ROMS) output. bikedata ...
[Read more...]

Interactive R visuals in Power BI

June 22, 2017 | David Smith

Power BI has long had the capability to include custom R charts in dashboards and reports. But in sharp contrast to standard Power BI visuals, these R charts were static. While R charts would update when the report data was refreshed or filtered, it wasn't possible to interact with an ... [Read more...]

Data wrangling : Reshaping

June 22, 2017 | Vasileios Tsakalos

Data wrangling is a task of great importance in data analysis. Data wrangling, is the process of importing, cleaning and transforming raw data into actionable information for analysis. It is a time-consuming process which is estimated to take about 60-80% of analyst’s time. In this series we will go ... [Read more...]

nanotime 0.2.0

June 22, 2017 | Thinking inside the box

A new version of the nanotime package for working with nanosecond timestamps just arrived on CRAN. nanotime uses the RcppCCTZ package for (efficient) high(er) resolution time parsing and formatting up to nanosecond resolution, and the bit64 package for the actual integer64 arithmetic. Thanks to a metric ton of work ... [Read more...]
1 2 3 4 5 6 16

Never miss an update!
Subscribe to R-bloggers to receive
e-mails with the latest R posts.
(You will not see this message again.)

Click here to close (This popup will not appear again)