June 2017

The Ulam Spiral (Euler Problem 28)

June 28, 2017 | Peter Prevos

Proposed solution to Euler Problem 28 in the R language for statistical computing. What is the sum of the numbers on the diagonals in a 1001 by 1001 spiral? Continue reading → The post The Ulam Spiral (Euler Problem 28) appeared first on The Devil is in the Data.
[Read more...]

Using wrapr::let() with tidyeval

June 28, 2017 | John Mount

While going over some of the discussion related to my last post I came up with a really neat way to use wrapr::let() and rlang/tidyeval together. Please read on to see the situation and example.Suppose we want to parameterize over a couple of names, one denoting a ... [Read more...]

Cross-Fitting Double Machine Learning estimator

June 28, 2017 | insightr

By Gabriel Vasconcelos Motivation In a late post I talked about inference after model selection showing that a simple double selection procedure is enough to solve the problem. In this post I’m going to talk about a generalization of the … Continue reading →
[Read more...]

HexJSON HTMLWidget for R, Part 1

June 28, 2017 | Tony Hirst

In advance of the recent UK general election, ODI Leeds published an interactive hexmap of constituencies to provide a navigation surface over various datasets relating to Westminster constituencies: As well as the interactive front end, ODI Leeds published a simple JSON format for sharing the hex data – hexjson that allows ...
[Read more...]

Working with the xlsx package Exercises (part 2)

June 28, 2017 | sindri

This exercise set provides (further) practice in writing Excel documents using the xlsx package as well as importing and general data manipulation. Specifically we have loops in order for you to practice scaling. A previous exercise set focused on writing a simple sheet with the same package, see here. We ... [Read more...]

Machine Learning Explained: Bagging

June 28, 2017 | EnhanceDataScience

Bagging is a powerful method to improve the performance of simple models and reduce overfitting of more complex models. The principle is very easy to understand, instead of fitting the model on one sample of the population, several models are fitted on different samples (with replacement) of the population. Then, ...
[Read more...]

Bar Plots and Modern Alternatives

June 28, 2017 | Easy Guides

This article describes how to create easily basic and ordered bar plots using ggplot2 based helper functions available in the ggpubr R package. We’ll also present some modern alternatives to bar plots, including lollipop charts and cleveland’s dot plots. Note that, the approach to build a bar plot, ... [Read more...]

GLM with H2O in R

June 27, 2017 | statcompute

Below is an example showing how to fit a Generalized Linear Model with H2O in R. The output is much more comprehensive than the one generated by the generic R glm(). [Read more...]

Modeling and prediction for movies

June 27, 2017 | Susan Li

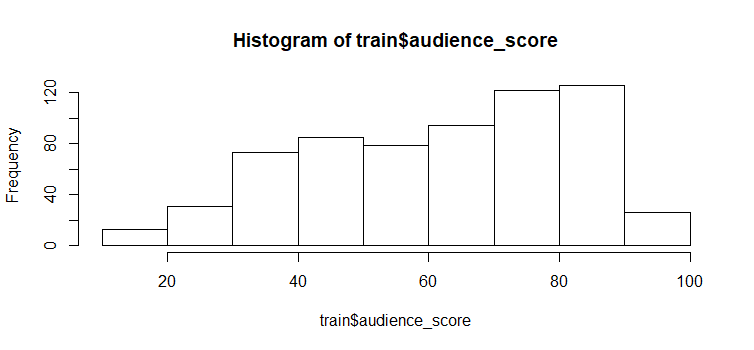
Setup This project details our analysis of the movie dataset that contains information from Rotten Tomatos and IMDB for a random sample of movies. The purpose of this project is to develop a multiple linear regression model to understand what att...
[Read more...]

Printing From Flex Dashboard

June 27, 2017 | R Views

Shiny applications of all stripes (including flexdashboard with runtime Shiny) are revolutionary in that they put the power of R directly in the end user’s hands without needing to interact directly with the language. A common way end-users wish to interact with their data is via a dashboard that ...
[Read more...]

The Mandelbrot Set in R

June 27, 2017 | benjaminlmoore

The Mandelbrot set is iconic and countless beautiful visualisations have been born from its deceptively simple recursive equation. R’s plotting ecosystem should be the perfect setting for generating these eye-catching visualisations, but to date the package support has been lacking. … Continue reading →
[Read more...]

Forecasting Economic Risk in the EU into 2020

June 27, 2017 | Jack Yip

Written by Chen Trilnik and Jack Yip. To view the original source code, visit our Github repo here.   I. Introduction Business Objective In the last decade, […] The post Forecasting Economic Risk in the EU into 2020 appeared first on NYC Data Science Academy Blog.
[Read more...]
1 2 3 4 16

Never miss an update!
Subscribe to R-bloggers to receive
e-mails with the latest R posts.
(You will not see this message again.)

Click here to close (This popup will not appear again)