June 2017

Introduction to Set Theory and Sets with R

June 8, 2017 | Aaron Schlegel

Sets define a ‘collection’ of objects, or things typically referred to as ‘elements’ or ‘members.’ The concept of sets arises naturally when dealing with any collection of objects, whether it be a group of numbers or anything else. Conceptually, the following examples can be defined as a ‘set’: {1, 2,... The post ... [Read more...]

Campaign Response Testing no longer published on Udemy

June 8, 2017 | John Mount

Our free video course Campaign Response Testing is no longer published on Udemy. It remains available for free on YouTube with all source code available from GitHub. I’ll try to correct bad links as I find them. Please read on for the reasons. Udemy recently unilaterally instituted a new ... [Read more...]

Neural networks Exercises (Part-1)

June 8, 2017 | Guillaume Touzin

Neural network have become a corner stone of machine learning in the last decade. Created in the late 1940s with the intention to create computer programs who mimics the way neurons process information, those kinds of algorithm have long been believe to be only an academic curiosity, deprived of practical ... [Read more...]

Introducing the MonteCarlo Package

June 8, 2017 | cleschinski

My first R package has been released on CRAN recently. It is named MonteCarlo and aims to make simulation studies as easy as possible – including parallelization and the generation of tables. What Are Simulation Studies Good For? Monte Carlo simulations are an essential tool in statistics and related disciplines. They ... [Read more...]

Deep Learning with R

June 8, 2017 | Rajiv Shah

For R users, there hasn’t been a production grade solution for deep learning (sorry MXNET). This post introduces the Keras interface for R and how it can be used to perform image classification. The post ends by providing some code snippets that show Keras is intuitive and powerful. Tensorflow ... [Read more...]

Add P-values and Significance Levels to ggplots

June 8, 2017 | Easy Guides

In this article, we’ll describe how to easily i) compare means of two or multiple groups; ii) and to automatically add p-values and significance levels to a ggplot (such as box plots, dot plots, bar plots and line plots …). Contents: Prerequisites Methods for comparing means R functions to add ... [Read more...]

UK R Courses

June 8, 2017 | csgillespie

Over the next few months we’re running a number of R, Stan and Scala courses around the UK. June (London) Mon Jun 26 – Introduction to R Tue Jun 27 – Statistical Modelling with R Wed Jun 28 – Programming with R Thu Jun 29 (2-day course) – Advanced R Programming August (Belfast) Thu Aug 10 […] [Read more...]

Tic Tac Toe Part 3: The Minimax Algorithm

June 7, 2017 | Peter Prevos

In two previous posts, I presented code to teach R to play the trivial game of Tic Tac Toe. I thought this was an unbeatable algorithm. Alas, a comment from Alberto shattered my pride as he was able to beat … Continue reading → The post Tic Tac Toe Part 3: The Minimax ... [Read more...]

MakeOverMonday Challenge

June 7, 2017 | R on Know Your Data

Makeovermonday is a weekly social data project with the intention to rework some random chosen chart. A new challenge is posted every week on the data set page. Although it is more focused to the Tableau community, I took the challenge to rework the chart with R. This is the ... [Read more...]

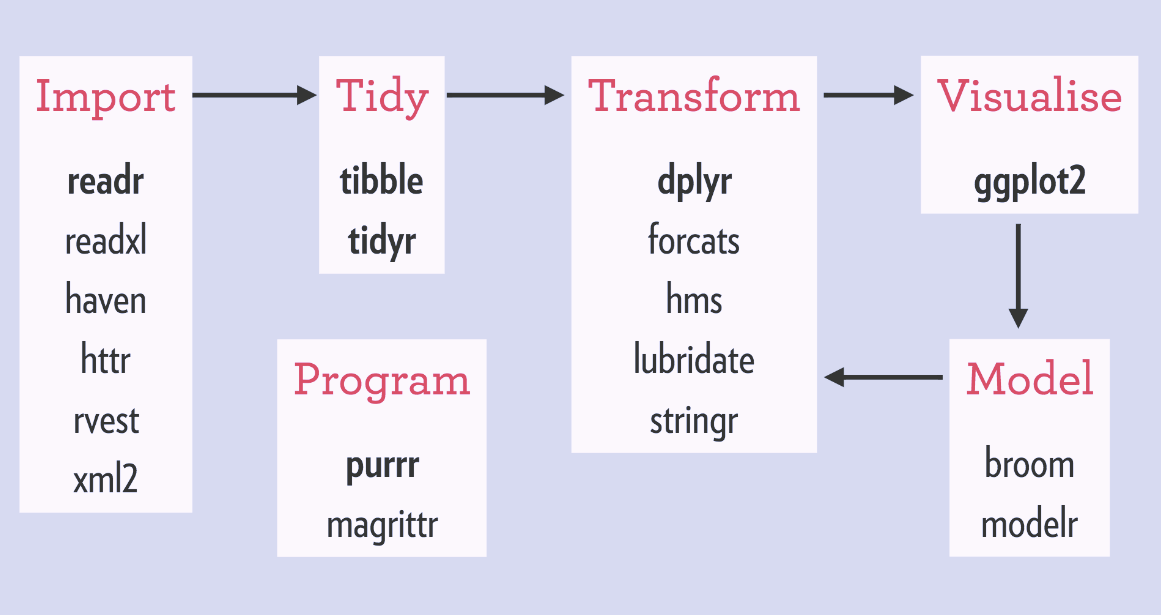
What is the tidyverse?

June 7, 2017 | R Views

Last week, I had the opportunity to talk to a group of Master’s level Statistics and Business Analytics students at Cal State East Bay about R and Data Science. Many in my audience were adult students coming back to school with job experience writing code in Java, Python and ...
[Read more...]

How to create dot-density maps in R

June 7, 2017 | David Smith

Choropleths are a common approach to visualizing data on geographic maps. But choropleths — by design or necessity — aggregate individual data points into a single geographic region (like a country or census tract), which is all shaded a single colour. This can introduce interpretability issues (are we seeing changes in the ... [Read more...]

More on safe substitution in R

June 7, 2017 | John Mount

Let’s worry a bit about substitution in R. Substitution is very powerful, which means it can be both used and mis-used. However, that does not mean every use is unsafe or a mistake. From Advanced R : substitute: We can confirm the above code performs no substitution: a
[Read more...]

quantmod 0.4-9 on CRAN

June 7, 2017 | Joshua Ulrich

A new release of quantmod is now on CRAN! The only change was to address changes to Yahoo! Finance and their effects on getSymbols.yahoo().  GitHub issue #157 contains some details about the fix implementation.Unfortunately, the URL wasn't the only thing that changed.  The actual data available for download changed ... [Read more...]

Data wrangling : I/O (Part-2)

June 7, 2017 | Vasileios Tsakalos

Data wrangling is a task of great importance in data analysis. Data wrangling, is the process of importing, cleaning and transforming raw data into actionable information for analysis. It is a time-consuming process which is estimated to take about 60-80% of analyst’s time. In this series we will go ... [Read more...]
1 10 11 12 13 14 16

Never miss an update!
Subscribe to R-bloggers to receive
e-mails with the latest R posts.
(You will not see this message again.)

Click here to close (This popup will not appear again)