October 2016

tractable Bayesian variable selection: beyond normality

October 16, 2016 | xi'an

David Rossell and Francisco Rubio (both from Warwick) arXived a month ago a paper on non-normal variable selection. They use two-piece error models that preserve manageable inference and allow for simple computational algorithms, but also characterise the behaviour of the resulting variable selection process under model misspecification. Interestingly, they show ...
[Read more...]

Changelog D3PartitionR V0.2

October 16, 2016 | guillotantoine

The V0.2 of D3partitionR is now available on gitlab ! (And will soon be available on the CRAN!) Changelog: New visualisation: collapsible tree Indented collapsible tree 2. New functionalities and improvement Shiny input: The partition charts can now be used as shiny input. Several inputs options are available: the clicked node, ... [Read more...]

MACD + SMI Trend Following and Parameter Optimization

October 16, 2016 | cfsmith

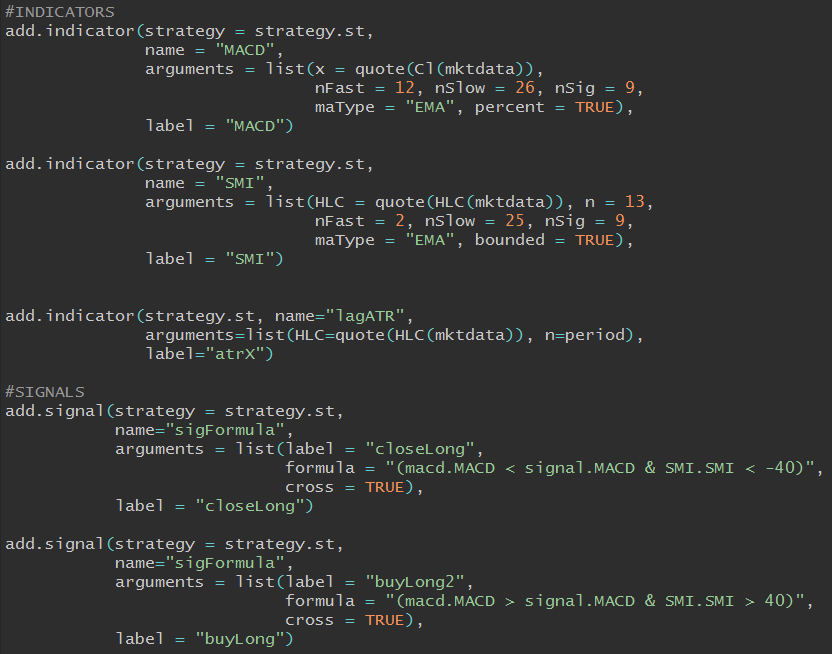
Finally a somewhat profitable strategy to analyze! This post will walk through the development of my MACD + SMI strategy, including my experience with parameter optimization and trailing stops. This strategy began with an interest in the Moving Average Convergence/Divergence oscillator (MACD), which I hadn’t yet explored. Also, since ...
[Read more...]

Visualizing Arkansas traffic fatalities, Part 3

October 16, 2016 | Nathan

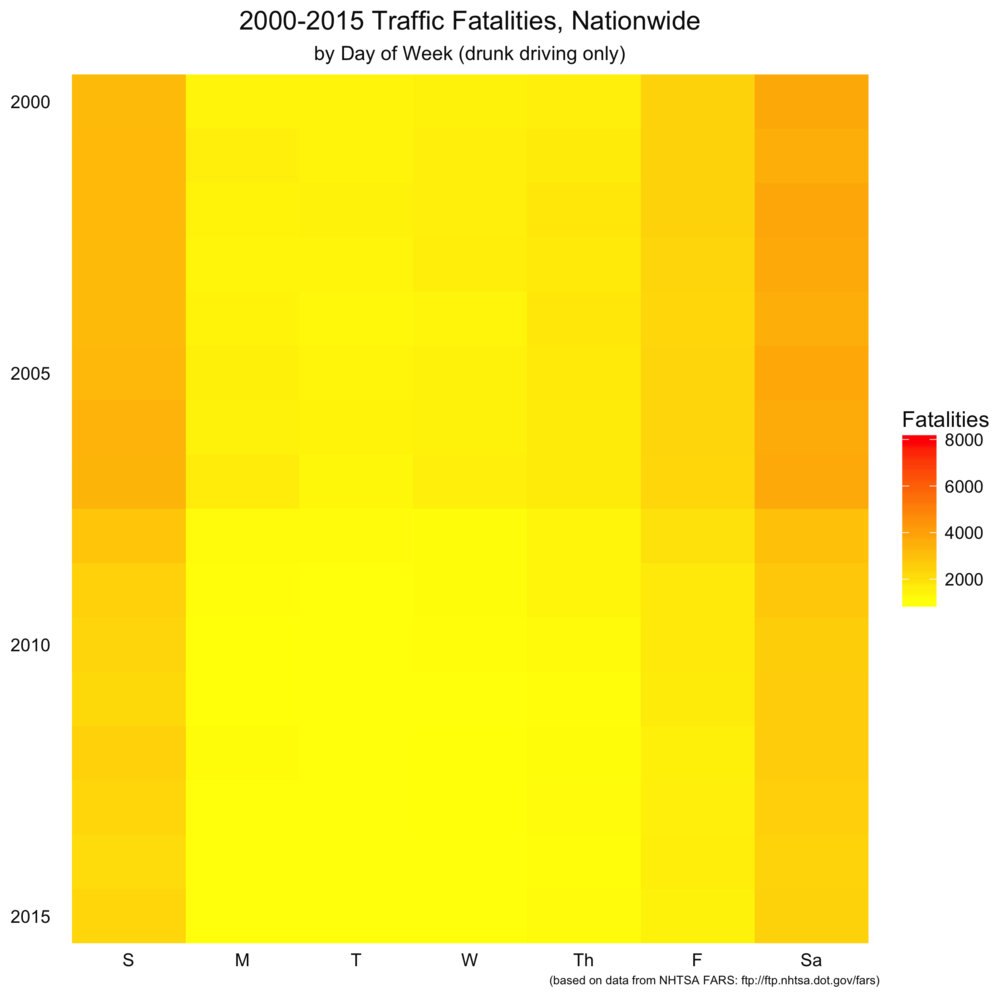
This is the latest post in a series analyzing Arkansas traffic fatalities. Please take a look at part 1 (a map of 2015 traffic deaths) and part 2 (a heat map of all fatalities, both nationwide and in Arkansas, from 200-2015) if you haven’t already. Visualizations Today’s visualization piggybacks off part 2, ... [Read more...]

Visualizing Arkansas traffic fatalities, Part 3

October 16, 2016 | Nathan Chaney

This is the latest post in a series analyzing Arkansas traffic fatalities. Please take a look at part 1 (a map of 2015 traffic deaths)  and part 2 (a heat map of all fatalities, both nationwide and in Arkansas, from 200-2015) if you haven't already. Visualizations Today's visualization piggybacks off part 2, in that ...
[Read more...]

tint 0.0.3: Tint Is Not Tufte

October 15, 2016 | Thinking inside the box

The tint package, whose name stands for Tint Is Not Tufte , on CRAN offers a fresh take on the excellent Tufte-style for html and pdf presentations. It marks a milestone for me: I finally have a repository with more "stars" than commits. Gotta keep an eye on the big prize... ... [Read more...]

USA/ Canada Roadtrip 2016

October 15, 2016 | Shirin's playgRound

Mapping GPS data from our USA/ Canada Roadtrip This September we went on a roadtrip to the US and Canada. Of course, we had our trusty GPS to guide us along the way - the data from which I downloaded and used to play around with. (If you want to ...
[Read more...]

Visualizing ROC Curves in R using Plotly

October 15, 2016 | Riddhiman

In this post we’ll create some simple functions to generate and chart a Receiver Operator (ROC) curve and visualize it using Plotly. See Carson’s plotly book for more details around changes in syntax. We’ll do this from a credit risk perspective i.e. validating a bank’s ... [Read more...]

The Grammar of Graphics and Radar Charts

October 15, 2016 | C

A radar chart (also known as a web chart, spider chart, or star chart) is described on Wikipedia as 'a two-dimensional chart of three or more quantitative variables represented on axes starting from the same point.'  Although this is an accurate description, it does not express the design and ...
[Read more...]

Tidyverse Presentation

October 15, 2016 | R-bloggers – JIDDU ALEXANDER

The slides of my presentation at Köln R User Meetup on 14 Oct 2016. It covers an introduction to tidy data, tidyverse packages, managing multiple models, managing learning curves and a few extra bits and bobs. The code that generated the content is available as R Notebook on github: github.com/...
[Read more...]

Progress bar overhead comparisons

October 15, 2016 | Peter Solymos

As a testament to my obsession with progress bars in R, here is a quick investigation about the overhead cost of drawing a progress bar during computations in R. I compared several approaches including my pbapply and Hadley Wickham’s plyr. [Read more...]

On the ifelse function

October 14, 2016 | Florian Privé

In this post, I will talk about the ifelse function, which behaviour can be easily misunderstood, as pointed out in my latest question on SO. I will try to show how it can be used, and misued. We will also check if it is as fast as we could expect ... [Read more...]

Optimize Data Exploration With Sapply() – Exercises

October 14, 2016 | John Akwei

The apply() functions in R are a utilization of the Split-Apply-Combine strategy for Data Analysis, and are a faster alternative to writing loops. The sapply() function applies a function to individual values of a dataframe, and simplifies the output. Structure of the sapply() function: sapply(data, function, ...) The dataframe used ... [Read more...]
1 7 8 9 10 11 15

Never miss an update!
Subscribe to R-bloggers to receive
e-mails with the latest R posts.
(You will not see this message again.)

Click here to close (This popup will not appear again)