
Association Rules on WideWorldImporters and SQL Server R Services
Want to share your content on R-bloggers? click here if you have a blog, or here if you don't.
Association rules are very handy for analyzing Retail data. And WWI database has really neat set of invoices that can be used to make a primer.
Starting with following T-SQL query:
USE WideWorldIMportersDW;
GO

;WITH PRODUCT
AS
(
SELECT
  [Stock Item Key]
 ,[WWI Stock Item ID]
 ,[Stock Item]
 ,LEFT([Stock Item], 8) AS L8DESC
 ,ROW_NUMBER() OVER (PARTITION BY LEFT([Stock Item], 8) ORDER BY ([Stock Item])) AS RN_ID_PR
 ,DENSE_RANK() OVER (ORDER BY (LEFT([Stock Item], 8))) AS PRODUCT_GROUP
 FROM [Dimension].[Stock Item]
)

SELECT
 O.[WWI Order ID]
,O.[Order Key]
,O.[Stock Item Key]
,P.PRODUCT_GROUP
,O.[Description]

FROM [Fact].[Order] AS O
JOIN PRODUCT AS P
    ON P.[Stock Item Key] = O.[Stock Item Key]

ORDER BY
    O.[WWI Order ID]
    ,O.[Order Key]
I have created very simple product group that will neglect distinction between product variants and treat them as one. For example:
Stock Item Key    WWI Stock Item ID    Stock Item
54                166                  10 mm Anti static bubble wrap (Blue) 20m
53                167                  10 mm Anti static bubble wrap (Blue) 50m
Both Products are initially the same just the product variant can change; color, size, cap, volume, etc. Product group denotes main products, “without” the product variants. I am doing this simplification out of practical reason, because of a smaller dataset.
So new version of product groups (variable ProductGroup) would be like:
Stock Item Key    WWI Stock Item ID    Stock Item      ProductGroup
54                166                  10 mm Anti      2
53                167                  10 mm Anti      2
So incorporating R code for analyzing association rules in sp_execute_external_procedure is what following code does:
-- Getting Association Rules into T-SQL
DECLARE @TSQL AS NVARCHAR(MAX)
SET @TSQL = N'WITH PRODUCT
                        AS
                      (
                      SELECT
                      [Stock Item Key]
                      ,[WWI Stock Item ID]
                      ,[Stock Item]
                      ,LEFT([Stock Item], 8) AS L8DESC
                      ,ROW_NUMBER() OVER (PARTITION BY LEFT([Stock Item], 8) ORDER BY ([Stock Item])) AS RN_ID_PR
                      ,DENSE_RANK() OVER (ORDER BY (LEFT([Stock Item], 8))) AS PRODUCT_GROUP
                      FROM [Dimension].[Stock Item]
                      )

                      SELECT
                      O.[WWI Order ID] AS OrderID
                      -- ,O.[Order Key]   AS OrderLineID
                      -- ,O.[Stock Item Key] AS ProductID
                      ,P.PRODUCT_GROUP AS ProductGroup
                      -- ,O.[Description] AS ProductDescription
                      ,LEFT([Stock Item],8) AS ProductDescription

                      FROM [Fact].[Order] AS O
                      JOIN PRODUCT AS P
                      ON P.[Stock Item Key] = O.[Stock Item Key]
                      GROUP BY
                       O.[WWI Order ID]
                      ,P.PRODUCT_GROUP
                      ,LEFT([Stock Item],8)
                      ORDER BY
                      O.[WWI Order ID]'

DECLARE @RScript AS NVARCHAR(MAX)
SET @RScript = N'
                library(arules)
                cust.data <- InputDataSet
                cd_f <- data.frame(OrderID=as.factor(cust.data$OrderID),
ProductGroup=as.factor(cust.data$ProductGroup))
                cd_f2_tran  <- as(split(cd_f[,"ProductGroup"], cd_f[,"OrderID"]),
"transactions")
                rules <- apriori(cd_f2_tran, parameter=list(support=0.01,
confidence=0.1))
                OutputDataSet <- data.frame(inspect(rules))'

EXEC sys.sp_execute_external_script
           @language = N'R'
          ,@script = @RScript
          ,@input_data_1 = @TSQL

WITH RESULT SETS ((
     lhs NVARCHAR(500)
    ,[Var.2] NVARCHAR(10)
    ,rhs NVARCHAR(500)
    ,support DECIMAL(18,3)
    ,confidence DECIMAL(18,3)
    ,lift DECIMAL(18,3)
                 ));
Result is retrieving rules of association between products from transaction that build up support and eventually give lift for any predictions.
By executing this R code:
# chart if needed
plot(rules, method="grouped", control=list(k=20));
one can generate also graphical view of the rules and associations between products.

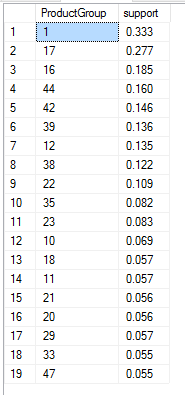
And finally to retrieve information on support for each of the ProductGroup (which is my case), I would execute this R code embedded into T-SQL:
DECLARE @TSQL AS NVARCHAR(MAX)
SET @TSQL = N'WITH PRODUCT
                        AS
                      (
                      SELECT
                      [Stock Item Key]
                      ,[WWI Stock Item ID]
                      ,[Stock Item]
                      ,LEFT([Stock Item], 8) AS L8DESC
                      ,ROW_NUMBER() OVER (PARTITION BY LEFT([Stock Item], 8) ORDER BY ([Stock Item])) AS RN_ID_PR
                      ,DENSE_RANK() OVER (ORDER BY (LEFT([Stock Item], 8))) AS PRODUCT_GROUP
                      FROM [Dimension].[Stock Item]
                      )

                      SELECT
                      O.[WWI Order ID] AS OrderID
                      -- ,O.[Order Key]   AS OrderLineID
                      -- ,O.[Stock Item Key] AS ProductID
                      ,P.PRODUCT_GROUP AS ProductGroup
                      -- ,O.[Description] AS ProductDescription
                      ,LEFT([Stock Item],8) AS ProductDescription

                      FROM [Fact].[Order] AS O
                      JOIN PRODUCT AS P
                      ON P.[Stock Item Key] = O.[Stock Item Key]
                      GROUP BY
                       O.[WWI Order ID]
                      ,P.PRODUCT_GROUP
                      ,LEFT([Stock Item],8)
                      ORDER BY
                      O.[WWI Order ID]'

DECLARE @RScript AS NVARCHAR(MAX)
SET @RScript = N'
                library(arules)
                cust.data <- InputDataSet
                cd_f <- data.frame(OrderID=as.factor(cust.data$OrderID),
ProductGroup=as.factor(cust.data$ProductGroup))
                cd_f2_tran  <- as(split(cd_f[,"ProductGroup"], cd_f[,"OrderID"]),
 "transactions")
                PgroupSets <- eclat(cd_f2_tran, parameter = list(support = 0.05),
control = list(verbose=FALSE))
                normalizedGroups <- PgroupSets[size(items(PgroupSets)) == 1]
                eachSupport <- quality(normalizedGroups)$support
                GroupName <- unlist(LIST(items(normalizedGroups), decode = FALSE))
                OutputDataSet <- data.frame(GroupName, eachSupport);'

EXEC sys.sp_execute_external_script
           @language = N'R'
          ,@script = @RScript
          ,@input_data_1 = @TSQL

WITH RESULT SETS ((
     ProductGroup NVARCHAR(500)
    ,support DECIMAL(18,3)
                 ));
This ProductGroupID can be joined with T-SQL
in order to receive labels:
 SELECT
 LEFT([Stock Item], 8) AS L8DESC
 ,DENSE_RANK() OVER (ORDER BY (LEFT([Stock Item], 8))) AS PRODUCT_GROUP
 FROM [Dimension].[Stock Item]

GROUP BY  LEFT([Stock Item], 8)
Pros and cons
Biggest pro is the ability to integrate association rules with T-SQL and to have all R code working as it should be. This gives data wrangles, data scientiest and data managers to workout the rules that are hidden in transactional/basket data. Working out with different types of outputs (support, confidence, lift) user get to see immediately what works with what. In my case you see and tell that the amount of original data (little over 73K transactions and little over 200K rows) is sometimes not enough to generate meaningful rules that have relevant content. If dataset would have been 100x times bigger, I am sure this would not be a case.
Data size falls under the con. Having larger dataset to be analysed, this would be a performance drawback in terms of memory consumption (sp_execute_external_script procedure is not being able to use RevoScaleR package and *.xdf data file) and speed. If RevoScaleR Package would have a function to support this calculation, I am very much confident that there would only be pros to Association Rules learning algorithm.
To sum up, association rules is a great and powerful algorithm for finding the correlations between items and the fact that you can use this straight from SSMS, it just gives me goosebumps. Currently just the performance is a bit of a drawback. Also comparing this algorithm to Analysis services (SSAS) association rules, there are many advantages on R side, because of maneuverability and extracting the data to T-SQL, but keep in mind, SSAS is still very awesome and powerful tool for statistical analysis and data predictions.
Code is available at Github.
Happy R-TSQLing!

R-bloggers.com offers daily e-mail updates about R news and tutorials about learning R and many other topics. Click here if you're looking to post or find an R/data-science job.
Want to share your content on R-bloggers? click here if you have a blog, or here if you don't.