November 2015

Geographic clustering of UK cities

November 23, 2015 | Adventures in Data

I know I am probably late to this party but I recently found out about DBSCAN or "A Density-Based Algorithm for Discovering Clusters in Large Spatial Databases with Noise"[^1]. In a nutshell, the algorithm visits successive data point and asks whether neighbouring points are density-reachable. In other words is it ... [Read more...]

A new blogging workflow

November 23, 2015 | Adventures in Data

Just disovered the Jekyll - github pages combination. Perfect for a very simple static blog site. I also found a pretty neat integration with RMarkdown which suits me perfectly, as I am mainly using R and will be posting bits and pieces of that. A summary of how it works... ... [Read more...]

Visualizing MLS Player Salaries with ggplot2

November 23, 2015 | Teja Kodali

Recently, I came across this great visualization of MLS Player salaries. I tried to do something similar with ggplot2, and while I was unable to replicate the interactivity or the tree-map nature of the graph, the graph still looks pretty cool. Data The data is contained in this pdf file. ... [Read more...]

Setting up an AWS instance for R, RStudio, OpenCPU, or Shiny Server

November 23, 2015 | gluc

While most web-developers have worked with Amazon AWS, Microsoft Azure, or similar platforms before, this is still not the case for many R number crunchers. Especially researchers at academic institutions have less exposure to these commercial offerings. Time to change that! In this post, we explain how to set up ...
[Read more...]

Are some seasons warming more than others?

November 23, 2015 | Gavin L. Simpson

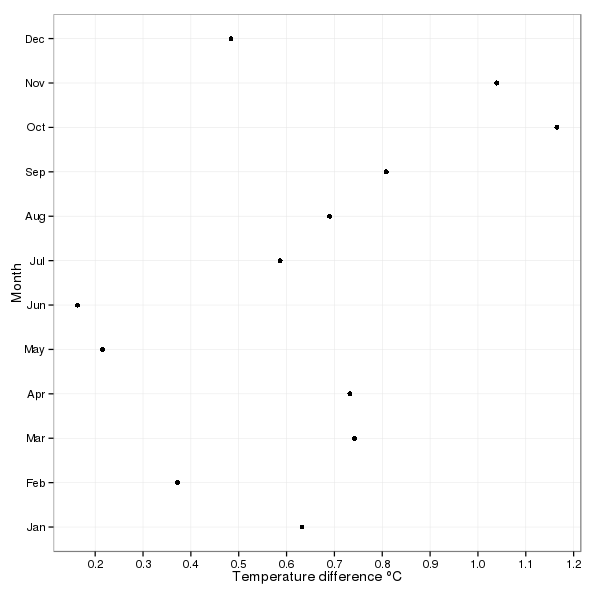
I ended the last post with some pretty plots of air temperature change within and between years in the Central England Temperature series. The elephant in the room1 at the end of that post was is the change in the within year (seasonal) effect over time statistically significant? This is ...
[Read more...]

Are some seasons warming more than others?

November 23, 2015 | Gavin L. Simpson

I ended the last post with some pretty plots of air temperature change within and between years in the Central England Temperature series. The elephant in the room1 at the end of that post was is the change in the within year (seasonal) effect over time statistically significant? This is ... [Read more...]

R Workshop at SFS Meeting

November 23, 2015 | fishR Blog

I just noticed that there will be an Introduction to R workshop at the Society for Freshwater Science Annual Meeting in Sacramento on 20-May-20-16. Here is a link to the announcement. [Read more...]

Scaling data.table using index

November 22, 2015 | Jan Górecki - R

R can handle fairly big data working on a single machine, 2B (2E9) rows and couple of columns require about 100 GB of memory. This is already well enough to care about performance. With this post I'm going discuss scalability of filter queries. The index has been introduced to data.table ...
[Read more...]

Twitter at conferences

November 22, 2015 | Egon Willighagen

I have been happily tweeting the BioMedBridges meeting in Hinxton last week using the #lifesciencedata hashtag, along with more than 100 others, though a small subset was really active. A lot has been published about using Twitter at conference, like the recent paper by Ekins et al (doi:10.1371/journal.pcbi.1003789).The ... [Read more...]

Twitter at conferences

November 22, 2015 | Egon Willighagen

I have been happily tweeting the BioMedBridges meeting in Hinxton last week using the #lifesciencedata hashtag, along with more than 100 others, though a small subset was really active. A lot has been published about using Twitter at conference, like t... [Read more...]

RRegrs: exploring the space of possible regression models

November 22, 2015 | Egon Willighagen

Machine learning is a field of science that focusses on mathematically describing patterns in data. Chemometrics does this for chemical data. Examples are (nano)QSAR where structural information is related to biological activity. I studied during my PhD studies the interaction between the statistics and machine learning with how you ... [Read more...]

Sunday morning puzzle

November 21, 2015 | xi'an

A question from X validated that took me quite a while to fathom and then the solution suddenly became quite obvious: If a sample taken from an arbitrary distribution on {0,1}⁶ is censored from its (0,0,0,0,0,0) elements, and if the marginal probabilities are know for all six components of the random vector, ... [Read more...]

Free gradient boosting lecture

November 21, 2015 | John Mount

We have always regretted that we didn’t get to cover gradient boosting in Practical Data Science with R (Manning 2014). To try make up for that we are sharing (for free) our GBM lecture from our (paid) video course Introduction to Data Science. (link, all support material here). Please help ... [Read more...]

Fun with Simpson’s Paradox: Simulating Confounders

November 21, 2015 | Joseph Rickert

Bob Horton Sr Data Scientist, Microsoft Wikipedia describes Simpson’s paradox as “a trend that appears in different groups of data but disappears or reverses when these groups are combined.” Here is the figure from the top of that article (you can click on the image in Wikipedia then follow ... [Read more...]
1 2 3 4 5 6 12

Never miss an update!
Subscribe to R-bloggers to receive
e-mails with the latest R posts.
(You will not see this message again.)

Click here to close (This popup will not appear again)