November 2015

Introduction to Circular Statistics – Rao’s Spacing Test

November 29, 2015 | Beau Lucas

Today will be a brief introduction in to circular statistics (sometimes referred to as directional statistics). Circular statistics is an interesting subdivision of statistics involving observations taken as vectors around a unit circle. As an example, imagine measuring birth times at a hospital over a 24-hour cycle, or the directional ... [Read more...]

Matrix exercises

November 28, 2015 | r-exercises

Please note, solutions are available here. Exercise 1 Create three vectors  x,y,z  with integers and each vector has 3 elements. Combine the three vectors to become a 3×3 matrix  A  where each column represents a vector. Change the row names to  a,b,c. Think: How about each row represents a ... [Read more...]

R User Group Activity 2015

November 27, 2015 | Joseph Rickert

by Joseph Rickert 2015 has been a good year for R user groups, both in terms of activity and the number of new groups founded. The plot below which runs 12/30/2012 through the week beginning with Monday 11/23/2015 shows that the number of weekly meeting continues to drift up to the right. You ... [Read more...]

Supervised Image Classification With Bio7, R And ImageJ

November 27, 2015 | » R

27.11.2015 I created a new Bio7 example which demonstrates how to classify an image with Bio7, ImageJ and R. For the classification I used the “randomForest” R package and an image example of ImageJ so you can reproduce the example quite easily. I made the example script as easy as possible ... [Read more...]

Efficient aggregation (and more) using data.table

November 27, 2015 | David Kun

In my recent post I have written about the aggregate function in base R and gave some examples on its use. This post repeats the same examples using data.table instead, the most efficient implementation of the aggregation logic in R, plus some additional use cases showing the power of ...
[Read more...]

Compression Benchmarks: brotli, gzip, xz, bz2

November 26, 2015 | Jeroen Ooms

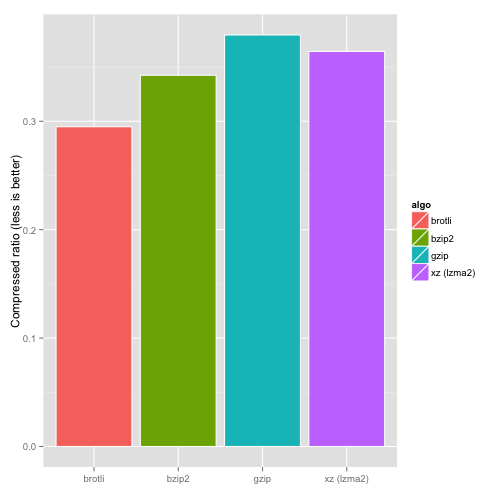
Brotli is a new compression algorithm optimized for the web, in particular small text documents. Brotli decompression is at least as fast as for gzip while significantly improving the compression ratio. The price we pay is that compression is much slower than gzip. Brotli is therefore most effective for serving ...
[Read more...]

Happy Thanksgiving!

November 26, 2015 | David Smith

Today is Thanksgiving Day in the United States, where the nation's citizens pause to reflect on what they are thankful for. I'd like to take this opportunity to give thanks to the members of the R Core Group who developed R, and continue to donate their time to help the ... [Read more...]

Automate the Boring Stuff: GGPlot2

November 26, 2015 | atmathew

The majority of my interaction with the ggplot2 package involves the interactive execution of code to visualize data within the context of exploratory data analysis. This is often a manual process and quite laborious. I recently sought to improve these tasks by creating a series of user defined functions that ... [Read more...]

TreeMap World Population visualisation

November 26, 2015 | gluc

This example is inspired by the examples of the treemap package. You’ll learn how to convert a data.frame to a data.tree structure navigate a tree and locate specific nodes use Aggregate and Cumulate manipulate an existing tree, e.g. by using the Prune method use data.tree ...
[Read more...]
1 2 3 4 12

Never miss an update!
Subscribe to R-bloggers to receive
e-mails with the latest R posts.
(You will not see this message again.)

Click here to close (This popup will not appear again)